
Figures & data
Table 1. Species-specific PCR primers for amplification of partial sequence of the calmodulin gene in A. niger or A. tubingensis.
Figure 1. Variations of culture pH at various RP concentrations during incubation period. Vertical bars denote standard deviation, n = 3.
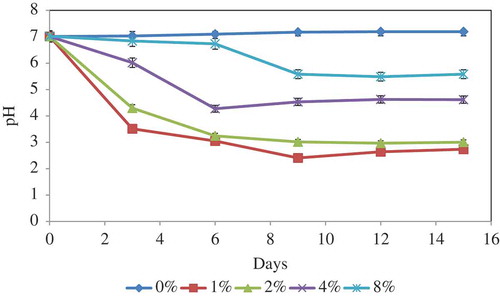
Figure 2. Phosphatase production at various RP concentrations during incubation period. Vertical bars denote standard deviation, n = 3.
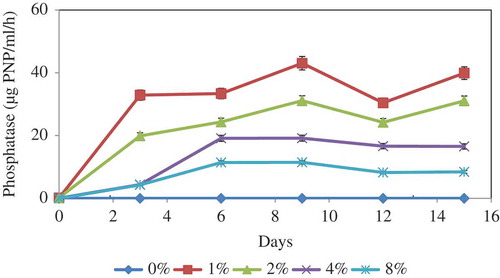
Table 2. Organic acid production by A. tubingensis SANRU at various RP concentration on day 9 of incubation time.
Figure 3. Solubilisation of P by A. tubingensis SANRU at various RP concentrations during incubation period. Vertical bars denote standard deviation, n = 3. Means with different letters are significantly different from each other (p < 0.05) according to the Tukey’s test.
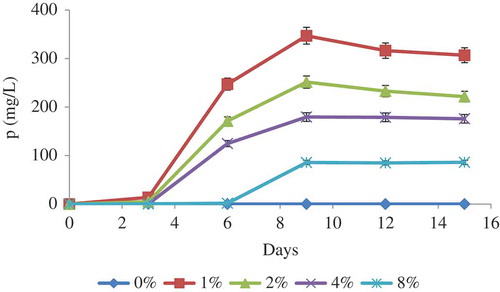
Table 3. Comparison of P solubilisation from rock phosphate in the present study and with those obtained in the literatures.
Figure 4. Relationship between pH (a), organic acid (b) and acid phosphatase (c) of bacterial culture and solubilised P. Each value represents the mean of three replicates with standard deviation shown by error bars.
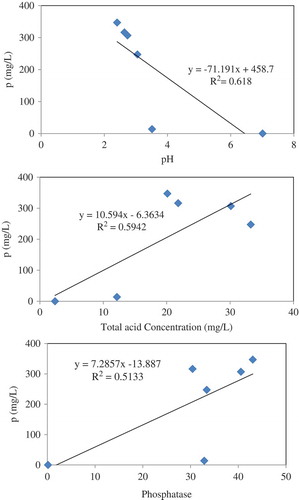
Figure 5. XRD diffractogram of RP of control (a) and solubilised by A. tubingensis SANRU (b), respectively, at the incubation period. Letter designations: A, apatite; C, calcite; H, haematite; D, dolomite; M, magnetite; Q, quartz.
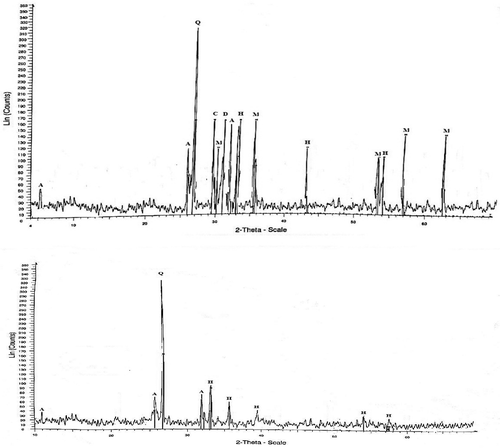
Table 4. XRF elemental analysis of RP before and after bio-solubilisation.