Figures & data
Figure 1. Effect of fungal VCs on A. thaliana in the presence of NaCl. Col-0 seedlings on medium containing no NaCl and 100 mM NaCl were co-cultivated with PDA only (control), two F. oxysporum strains (NRRL26379 and NRRL38335) and two V. dahliae strains (PD322 and PD413) for 14 days. Representative images after treatment (a), leaf surface area (b), leaf chlorophyll content (c) and lateral root density (d) are shown. Values shown correspond to the mean ± SE of data from three replicates (n = 15). Different letters indicate significant difference among treatments, according to Fisher’s least significant difference (LSD) test at P = 0.05.
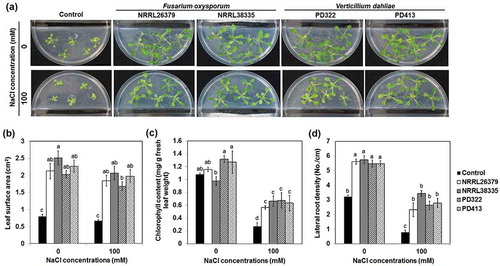
Figure 2. Growth responses of A. thaliana auxin signalling mutants to V. dahliae VCs in the presence of NaCl. Col-0 wild type (WT) and mutants of Col-0 defective in polar auxin transport (aux1-7) or auxin response (tir1-1 and axr1-3) on medium containing 100 mM NaCl were co-cultivated with PDA only (control) and V. dahliae strains PD322 and PD413 for 14 days. Leaf surface area (a) and lateral root density (b) after treatment are shown. Values shown correspond to the mean ± SE of data from three replicates (n = 15). Different letters indicate significant difference among treatments, according to Fisher’s LSD test at P = 0.05.
Figure 3. Expression of GUS in root tips of transgenic A. thaliana Col-0 containing DR5::GUS. Plants were stained for GUS activity after 7 days of co-cultivation with PDA only (control) and V. dahliae strains PD322 and PD413. Plants were cultured on medium containing no NaCl or 100 mM NaCl. The number of root tips expressing GUS for each treatment is shown. Values shown correspond to the mean ± SE of data from three replicates (n = 15). Different letters indicate significant difference among treatments, according to Fisher’s LSD test at P = 0.05.
Figure 4. Growth response of A. thaliana to V. dahliae VCs in the presence of an inhibitor of polar auxin transport, 100 mM NaCl, or both. Leaf surface area (a) and lateral root density (b) of Col-0 seedlings co-cultivated with PDA only (control) and V. dahliae strains PD322 and PD413 for 14 days under three conditions, including no NaCl, 100 mM NaCl (Na100) and a combination of 100 mM NaCl and 10 μM NPA (Na100 + NPA10), are shown. The same volume of DMSO was used for all treatments. Values shown correspond to the mean ± SE of data from three replicates (n = 15). Different letters indicate significant difference among treatments, according to Fisher’s LSD test at P = 0.05.
Figure 5. Expression of two defence-related genes in leaves of A. thaliana after exposure to fungal VCs. Transgenic A. thaliana Col-0 seedlings containing PR1::GUS (a) and PDF1.2::GUS (b), respectively, were co-cultivated with PDA only (control), V. dahliae (PD322) and F. oxysporum (NRRL26379 and NRRL38335) for 7 days. Blue staining indicates the activity of expressed GUS in planta. Scale bar = 500 μm.
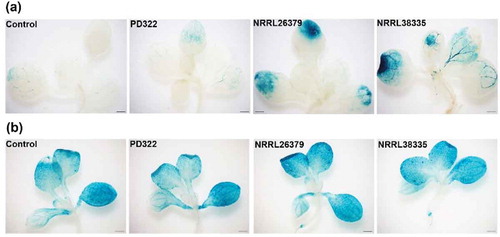
Figure 6. Effect of F. oxysporum VCs on A. thaliana defence against P. syringae. After co-cultivating Col-0 seedlings with PDA only (control) and F. oxysporum (NRRL26379 and NRRL38335) for 12 days, the seedlings were inoculated with Pst DC3000. Disease severity (a) was scored as the percentage of total leaf surface with symptoms, ranging from 0 (no symptoms) to 100 (complete chlorosis or necrosis). The number of bacterial cells in inoculated leaves (b) under each treatment is shown. Values shown correspond to the mean ± SE of data from three replicates (n = 15). Different letters indicate significant difference among treatments, according to Fisher’s LSD test at P = 0.05.