Figures & data
Table 1. Antagonist index after 10 days the assay started. Numbers correspond to the Bell scale modified.
Figure 1. Photographs of PDA plates with Trichoderma and phytopathogenic strains after 10 days the assay started. Trichoderma strains were inoculated on the left side of the plate while phytopathogens were inoculated on the right side of the plate.
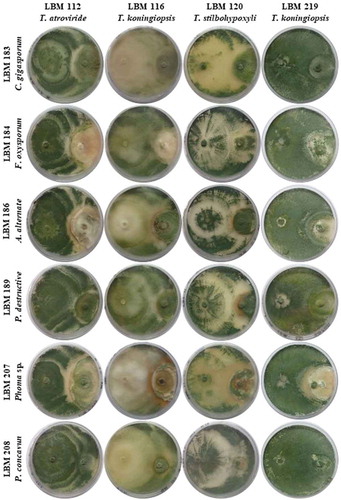
Figure 2. Photograph of interaction zones between Trichoderma and phytopathogenic strains after 10 days of incubation seen at a light microscope. A. Trichoderma atroviride LBM 112 interaction with A. alternata LBM 186 (40X); B. Trichoderma koningiopsis LBM 116 interaction with C. gigasporum LBM 184 (40X); C. Trichoderma stilbohypoxyli LBM 120 confronted with Phoma sp. LBM 207 (10X); D. Trichoderma koningiopsis LBM 219 confronted with Phoma sp. LBM 207 and E. Trichoderma koningiopsis LBM 219 confronted with F. oxysporum LBM 183 (10X). Yellow arrows show Trichoderma spores around pathogen hyphae and red arrows indicate the circular winding between T. koningiopsis LBM 219 and phytopathogens.
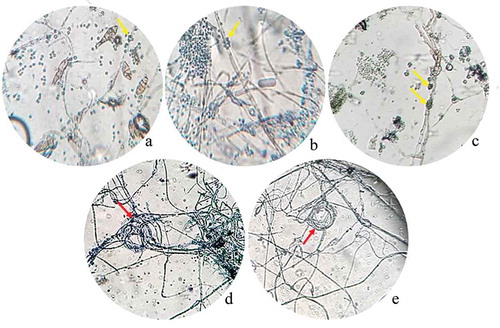
Figure 3. Percentage of phytopathogen growth inhibition by diffusible metabolites produced by Trichoderma strains. Standard error is represented with bars. The letter above the bars indicates homogenous group formation.
Figure 4. Percentage of phytopathogen growth inhibition by volatile metabolites produced by Trichoderma strains. Standard error is represented with bars. The letter above the bars indicates homogenous group formation.
Figure 5. Photographs of the qualitative method of volatile metabolites production after seven days the assay started. The letter above the bars indicates homogenous group formation. Trichoderma strains were inoculated on the left side of the plate while phytopathogens were inoculated on the right side of the plate. Plate controls were only inoculated on the right side with pathogen strains.
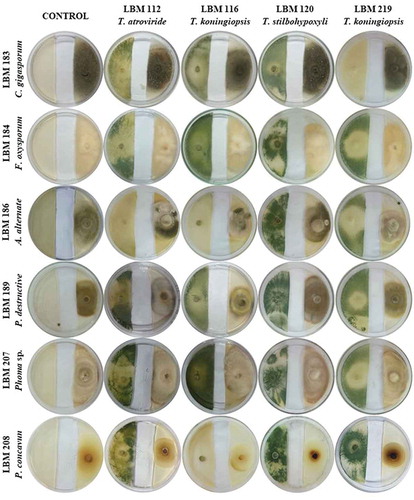
Figure 6. Plates show the results obtained from enzymatic determination, phosphate solubilisation and siderophore production. A. Endoglucanase activity*. B. Lipolytic activity*. C. Proteolytic activity*. D. Siderophore 1 production for T. atroviride LBM 112 and T. koningiopsis LBM 219. E. Siderophore 1 production for T. koningiopsis LBM 116 and T. stilbohypoxyli LBM 120. F. Positive results of chitinase activity. G. Siderophore 2 production as positive result. H. Phosphate solubilisation, 2: Trichoderma atroviride LBM 112, 7: Trichoderma koningiopsis LBM 116, 11: Trichoderma stilbohypoxyli LBM 120 and H: Trichoderma koningiopsis LBM 219. *The order of the strains on Petri plates is: Trichoderma koningiopsis LBM 116 at the top, on the left-hand side; T. atroviride LBM 112 at the top, on the right-hand side; T. koningiopsis at the bottom, on the left-hand side, T.stilbohypoxyli LBM 120 at the bottom, on the right-hand side.
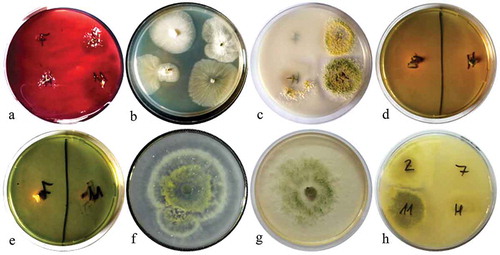
Figure 7. Dendrogram obtained with NTSys program using UPGMA and Jacard´s correlation.
Figure 8. In vivo assay results. Representation of total, aerial part and root dry weight in grams. Standard error is represented with bars. The letter above the bars indicates homogenous group formation.