Figures & data
Table 1. List of brown-rot fungal gene expression datasets used in our study.
Figure 1. Time scale panel generated by the TimeTree-the time scale of life web-database. The time scale panel displays the divergence of geological time scale, earth impacts, levels of oxygen, carbon dioxide and solar luminosity. Time divergence between all the selected taxa except for F. radiculosa is displayed above the time scale panel.
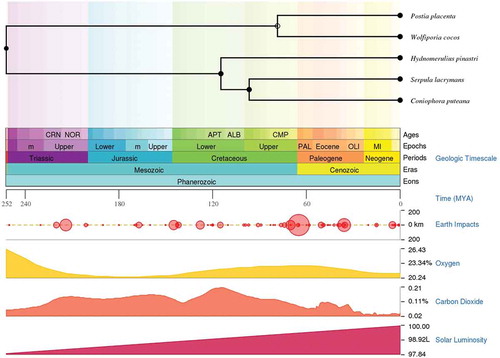
Figure 2. Pictorial representation of genome wide distribution genes encoding for hydrogenosomal/mitochondrial iron uptake and metabolism, [Note: P.pl = Rhodonia placenta, W.co = Wolfiporia cocos, C.pu = Coniophora puteana, H.pi = Hydnomerulius pinastri, S.la = Serpula lacrymans and F.ra = Fibroporia radiculosa] .
![Figure 2. Pictorial representation of genome wide distribution genes encoding for hydrogenosomal/mitochondrial iron uptake and metabolism, [Note: P.pl = Rhodonia placenta, W.co = Wolfiporia cocos, C.pu = Coniophora puteana, H.pi = Hydnomerulius pinastri, S.la = Serpula lacrymans and F.ra = Fibroporia radiculosa] .](/cms/asset/90b4a4f6-4aa9-4d97-bffe-56c43eb31c75/tmyc_a_1703052_f0002_oc.jpg)
Figure 3. (a) Violin plots showing the distribution of differentially expressed significant genes in GSE12540, GSE29656, GSE69012, and GSE84529 datasets. Venn diagrams showing the number of commonly expressed genes among the R. placenta datasets (b) Venn diagram of differentially expressed significant genes among the GSE12540-GSE29656 datasets experimental conditions where BMA- Ball milled aspen, BMP-Ball milled pine, GLU- glucose, CEL-Cellulose. (c) Venn diagram of differentially expressed significant genes among the experimental conditions of GSE69012 dataset where A- high lignin: low glucose, B- low lignin: high glucose, C- average lignin: average glucose, ABC-10, ABC-20 and ABC-30 refers to genes common among A,B and C datasets cultured at 10, 20 and 30 days of incubation periods, (d) Venn diagram of differentially expressed significant genes among the experimental conditions of GSE84529 dataset where 0-5mm vs 15-20mm, here we have compared the differentially expressed gene list obtained from 0-5mm vs 15-20mm growth conditions similar for other compared conditions 30-35mm vs 0-5mm and 30-35mm vs 15-20mm respectively.
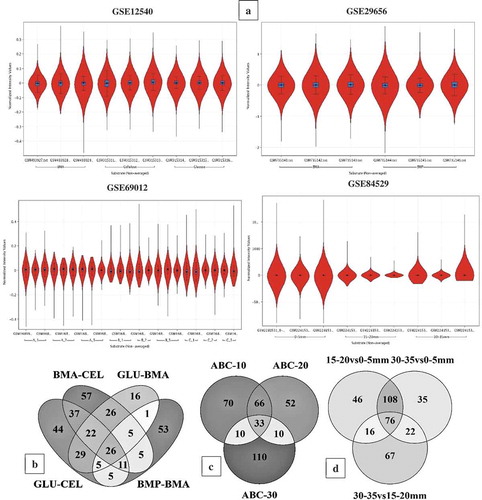
Figure 4. (a) Violin plots showing the distribution of differentially expressed significant genes obtained in GSE78007 dataset, (b) Six-way Venn diagram showing the number of commonly expressed genes among the experimental conditions of GSE78007 dataset, (c) Three-way Venn diagram showing the number of common differentially expressed significant genes among the H. pinastri, S. lacrymans, C. puteana in GSE64897 dataset.
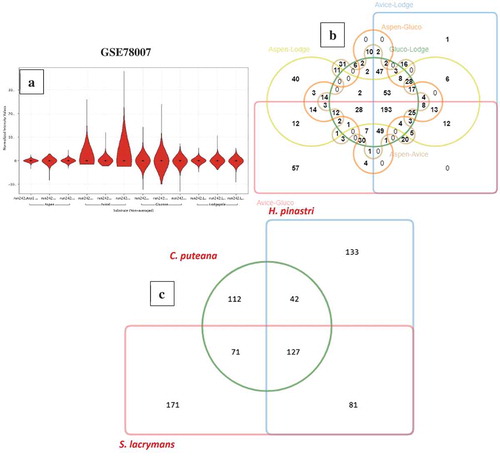
Figure 5. Six-way Venn diagrams showing the number of commonly expressed genes among the (a) genome wide proteomic annotations and (b) differentially expressed significant genes from the gene expression datasets.
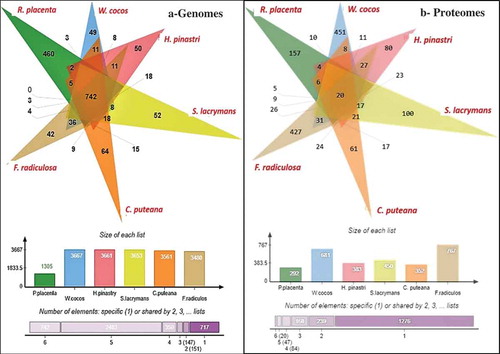
Figure 6. Pictorial representation of genome-wide CAZymes (a) genome wide distribution of CAZymes among all the selected brown rot fungi. (b) ligninolytic- auxiliary activity (AA), (c) pectinolytic, (d) cellulolytic, (e) hemicellulolytic, (f) tentative distribution of genes encoding for lignocellulolytic CAZymes in Rhodonia placenta (P. p), Fibroporia radiculosa (F. r), Wolfiporia cocos (W. c), Coniophora puteana (C. p), Serpula lacrymans (S. l), Hydnomerulius pinastri (H. p). [Note: ): AA = Auxiliary Activity, CBM = Carbohydrate binding modules, CE = Carbohydrate esterases, EXPN = Expansins, GH = Glycoside hydrolases, PL = Polysaccharide lyases and CAZY = Total number of carbohydrate active enzymes] .
![Figure 6. Pictorial representation of genome-wide CAZymes (a) genome wide distribution of CAZymes among all the selected brown rot fungi. (b) ligninolytic- auxiliary activity (AA), (c) pectinolytic, (d) cellulolytic, (e) hemicellulolytic, (f) tentative distribution of genes encoding for lignocellulolytic CAZymes in Rhodonia placenta (P. p), Fibroporia radiculosa (F. r), Wolfiporia cocos (W. c), Coniophora puteana (C. p), Serpula lacrymans (S. l), Hydnomerulius pinastri (H. p). [Note: Figure 5(a): AA = Auxiliary Activity, CBM = Carbohydrate binding modules, CE = Carbohydrate esterases, EXPN = Expansins, GH = Glycoside hydrolases, PL = Polysaccharide lyases and CAZY = Total number of carbohydrate active enzymes] .](/cms/asset/e331a3fc-47f4-4011-a686-f86b5e33f573/tmyc_a_1703052_f0006_oc.jpg)
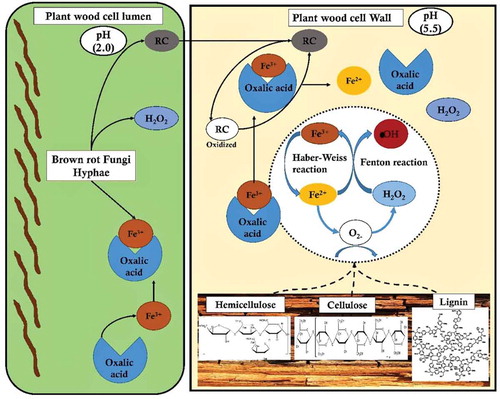
Figure 7. Pictorial representation of brown-rot fungal Fenton’s reaction mechanism differentiating the reaction mechanism in plant wood cell lumen and plant wood cell wall.