Figures & data
Figure 1. The endocytic process at the sub-apical collar of FF
Schematic depiction of the process of endocytosis as elucidated from Saccharomyces cerevisiae (Lu et al. Citation2016). A hyphal apex is shown in the lower left corner, with a close-up partial representation of membrane bending, invagination, and scission of a vesicle. General components are highlighted as the specific proteins involved may vary from one species to another. One major difference from S. cerevisiae is that clathrin has been shown not to localise to endocytic sites in the sub-apical collar in some filamentous fungi (Schultzhaus et al. Citation2017). Note: image was inspired by (Lu et al. Citation2016), and is not drawn to scale.
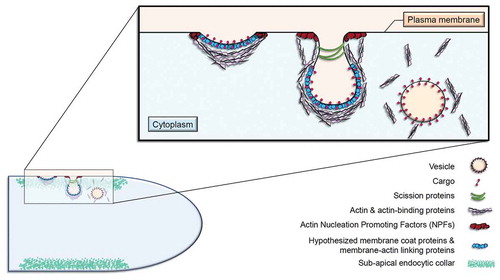
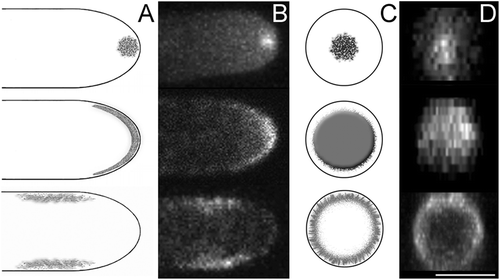
Figure 2. Three apical areas to which proteins associated with membrane turnover localise
(a) Schematic depiction of the three areas associated with endocytosis at the apices of growing hyphae, viewed from the side. (A, top) The Spitzenkörper (SPK) stains readily with the vital stain FM4-64, suggesting that it functions in the recycling of endocytic vesicles that are produced at the hyphal tip. (A, middle) Cell-end markers line the apical crescent, or dome, and localise growth machinery to hyphal tips. (A, bottom) The sub-apical collar is an area enriched for endocytosis where apical recycling takes place. (b) Fluorescence images of each of the three areas, represented by Aspergillus nidulans DnfB::GFP (Schultzhaus et al. Citation2015), HapA::GFP (unpublished data), and EcoA::GFP (unpublished data), respectively. (c-d) Schematic depiction & fluorescence images of the three areas as viewed from the apex of the hypha. Scale bar 2.5 µm.