Figures & data
Figure 1. (A) Precursor solution containing 5 mM FeCl3 and 5 mM FeSO4 at pH 7, and (B) after mixing with the extract of F. proliferatum. Dark greenish colour indicates the presence of oxidised forms of iron, while the colour change to orange/brown is attributed to the formation of reduced forms of iron.
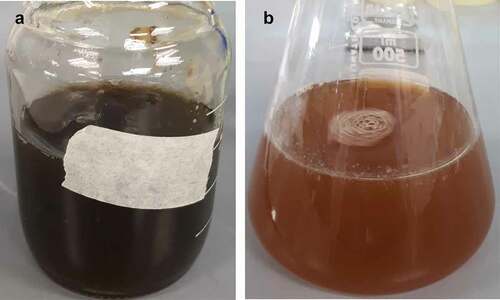
Figure 2. UV-vis spectra of the extract from F. proliferatum, the precursor salt solution (5 mM FeCl3 + 5 mM FeSO4, pH 7), and the Fe-NPs synthesised, sampled at various time intervals.
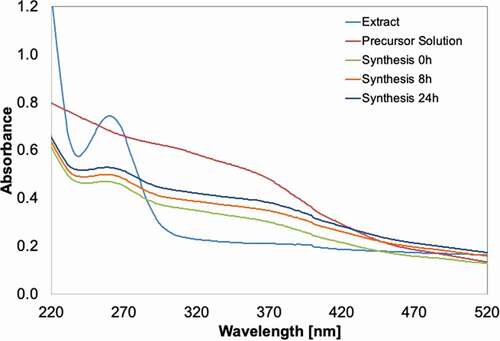
Figure 3. Scanning Electron Microscopy (SEM) micrographs of (A) Fe-NPs and (B) precursor precipitates at 50x (A1, B1) and 150x (A2, B2) magnification. Scale bar 1 µm/300 nm.
Table 1. Elemental composition of Fe-NPs and precursor precipitates determined by EDX-analysis
Figure 4. Electron-Dispersive X ray (EDX) spectra for (A) Fe-NPs and (B) precursor precipitates.
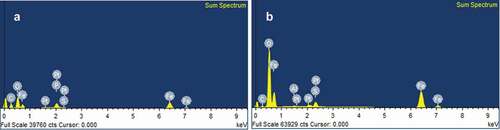
Figure 5. FTIR-spectra of powderised (A) Fe-NPs and (B) precursor precipitates.
Figure 6. Decolourization Efficiency (DE, %) of Fe-NPs and precursor precipitates towards various TPM-dyes (MG-malachite green, MV-methyl violet, CV-crystal violet and CB-cotton blue). Means with the same letters and caption are not significantly different at HSD(0. 05). Error bars indicate Standard error of mean (±SEM).
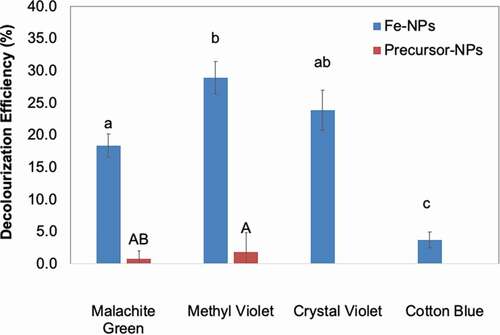
Figure 7. Decolourization Efficiency (DE, %) for TPM-dyes (A) malachite green, (B) methyl violet, (C) crystal violet and (D) cotton blue, over 8 days. Means with the same letters and caption are not significantly different at HSD(0.05). Error bars indicate Standard error of mean (±SEM).
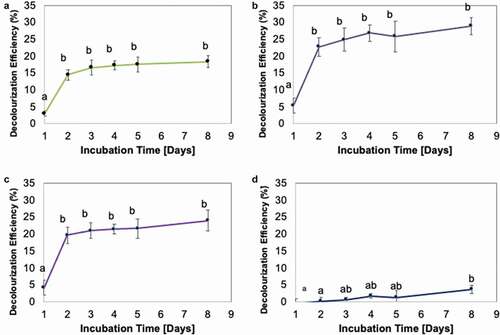
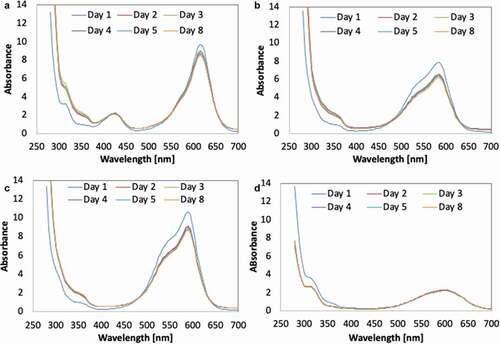
Figure 8. UV-vis spectra of TPM-dyes (A) malachite green, (B) methyl violet, (C) crystal violet and (D) cotton blue, upon treatment with Fe-NPs.