Figures & data
Figure 1. DIC light micrographs of Miracula einbuarlaekurica at different lifecycle stages in the freshwater pennate diatoms Ulnaria acus and Synedra ulna. (a) Early infection, with developing naked endobiotic holocarpic thalli, with remnants of a single encysted spore attached at the central area of the frustule (red arrow); (b) elongating unbranched thallus in an intermediate stage of development, causing gradual degradation of the host chloroplast into Orange-golden brown to chestnut-coloured residues; (c–f) late developmental stages, in diatoms containing a single (c) and multiple (d) thalli, with swellings forcing apart the host valves (c) or causing hyperthrophy (d); (e) fully formed mass of primary aplanospores within the sporangium (red arrow); (g, h) clusters of immotile primary spores at the orifice of the discharge tubes (h, red arrows); (i) zinc iodine stained empty thallus of M. einbuarlaekurica with a Spreizapparat at the base of each discharge tube (red arrows).
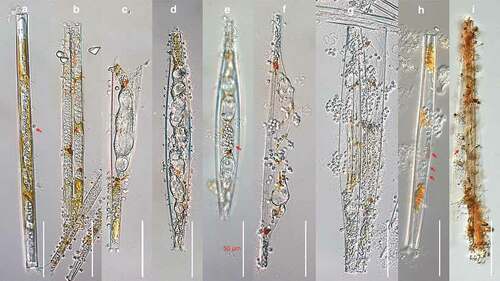
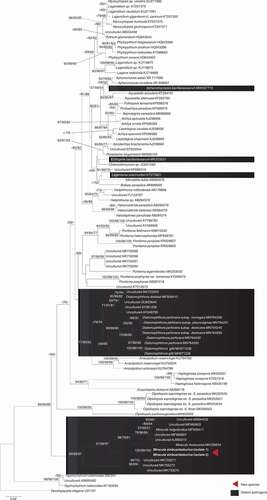
Figure 2. Molecular phylogeny based on minimum evolution analysis inferred of partial nrssu (18s) sequences. numbers on branches denote bootstrap values from maximum likelihood, minimum evolution, and maximum parsimony analyses, in the respective order. A dash “-“ indicates less than 60% bootstrap support or a conflicting topology.