
Figures & data
Figure 1. Phylogenic analyses of the C. auris strains isolated from China compared to other C. auris strains. The two strains (XM1803 and XM1805) isolated from Xiamen, China, are highlighted in green and the other isolates from China are highlighted in red. Twenty-one additional C. auris isolates representing the five genetic clades are also included (highlighted in black). The maximum-likelihood phylogenetic tree was generated based on ITS sequences. The scale bar indicates the number of nucleotide substitutions per site.
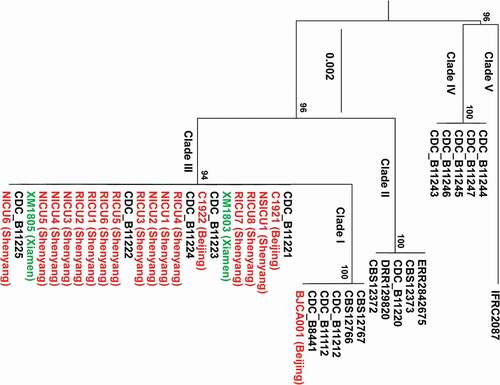
Table 1. MICs and Erg11 mutations of the 20 C. auris clinical isolates from China
Table 2. Clinical information of the 20 C. auris clinical isolates from mainland China
Figure 2. PCR analyses of the MTL loci of the different C. auris strains isolated from China. The MTL loci (MTLa or MTLα) of the twenty C. auris strains isolated from China were determined by PCR chemotyping.
Figure 3. Colony and cellular morphologies of the different C. auris strains. Strains XM1803, XM1805, C1921, C1922, NSICU1, RICU4, and BJCA001 were isolated from China. The MTLa strains, CBS12766 and B11245, were isolated from India and Venezuela, respectively. Yeast-form cells were plated onto YPD medium supplemented 5 μg/mL of phloxine B and incubated at 25°C for seven days. Scale bar = 10 μm.
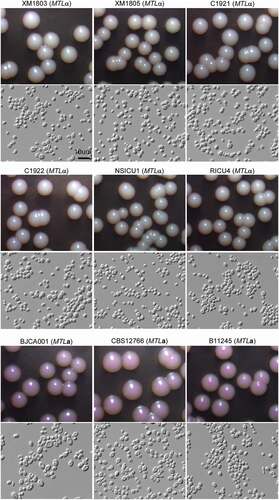
Figure 4. Sap expression for the different C. auris strains. Strains XM1803, XM1805, C1921, C1922, NSICU1, RICU4, and BJCA001 were isolated from China. The MTLa strains, CBS12766 and B11245, were isolated from India and Venezuela, respectively. Approximately 5 × 10⁶ yeast-form cells of each strain in 5 μL ddH2O were spotted onto YCB-BSA medium plates and incubated at 25°C or 37°C for seven days. The white precipitation zones (halos) indicate the activity of the Saps. The widths (mm) of the zones were measured and shown below the corresponding image (n = 3). N/A = no obvious halos were observed.
Data availability
All data generated or analysed during this study are included in this published article.