
Figures & data
Table 1. Characteristics comparison between typical and nontypical rock fungi
Figure 1. Growth rate comparison on culture plates between litholithic fungi and lithotolerant fungi of rock-inhabiting fungi. Values of plots represents growth rates (mm. per week) of published RIF species on culture plates. Significant difference between green and Orange plots represents the distinction between typical and nontypical RIF.
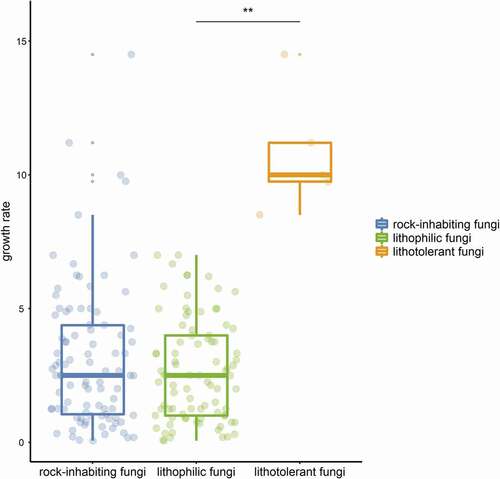
Table 2. Species numbers and their affiliation of rock-inhabiting fungi
Figure 2. Distribution of rock-inhabiting fungi. Size of blue circles represents the genus number of rock-inhabiting fungi.
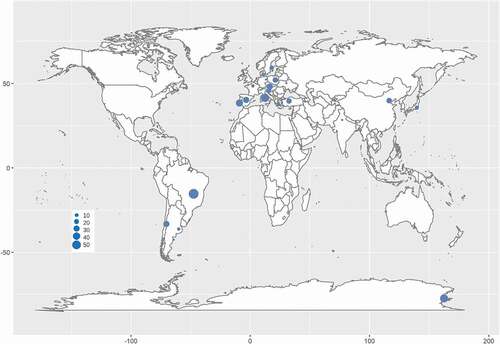
Table 3. Genomes of rock-inhabiting fungi and related strains