
Figures & data
Table 1. Amplicon size, fungal specificity, and the sequences of primers used.
Figure 1. Variation in the SynMock community composition depending on the primer pair used (fITS7/ITS4 in red; gITS7/ITS4 in green and 5.8S-Fun/ITS4-fun in blue), the addition of PNA clamps (+PNA) and the ratio of plant-mock DNA (50:50 or 80:20). (a) OTU Bray-Curtis dissimilarity between classic amplification (Ta = 57 °C) and the various conditions tested. (b) Relative abundance of the 12 OTUs composing the SynMock.
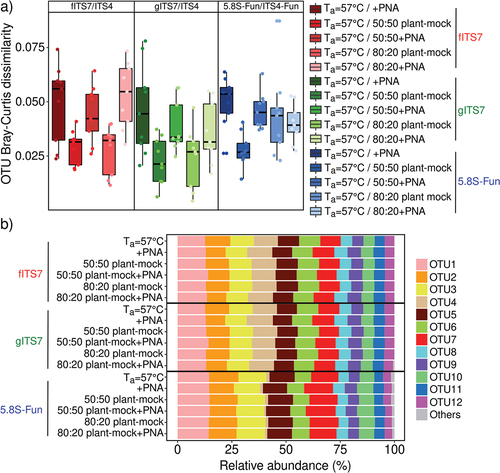
Table 2. Mean number of fungal sequences (±SE) obtained using the SynMock community for the three primer pairs (Ta = 57 °C) and the various combined treatments tested.
Figure 2. Abundance, richness and diversity of fungi in Urtica dioica roots for the three primer pairs tested fITS7/ITS4, gITS7/ITS4, and 5.8S-Fun/ITS4-fun (Ta = 57 °C), the addition of PNA clamps (+PNA) and the increase of Ta (Ta = 68 °C or 63 °C). (a–c) Relative abundance of reads of Viridiplantae, fungi, and other phyla (i.e. Amoebozoa, Choanoflagellozoa, Heterolobosa, Ichthyosporia, Metazoa, Protista, Rhizaria, rhodoplantae, Stramenopila, and NA); (d–f) Richness and (g–i) Shannon’s index. Boxes with the same letters did not differ significantly from each other using a Tukey-adjusted comparison and Kruskal-Wallis analysis followed by a post-hoc test using Fisher’s least significant difference, respectively, P < 0.05.
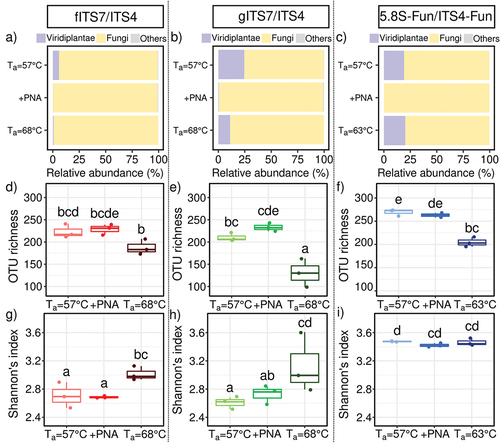
Figure 3. Percentage reduction in the number of OTUs for each primer pairs (fITS7/ITS4, gITS7/ITS4, and 5.8S-Fun/ITS4-fun) compared to the number of OTUs obtained with 5.8S-Fun, subsampled at various sequencing depths.
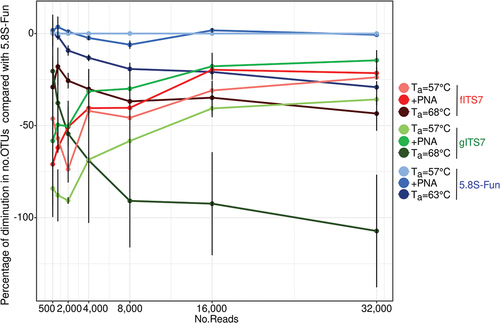
Figure 4. Fungal community composition in Urtica dioica roots depending on the primer pair used fITS7/ITS4, gITS7/ITS4, and 5.8S-Fun/ITS4-fun (Ta = 57 °C), the addition of PNA clamps (+PNA) and a higher Ta (Ta = 68 °C or 63 °C). (a) Non-metric multidimensional scaling (NMDS) analysis of the fungal communities, based on OTUs composition; (b) Relative abundance and F-value from linear mixed-effect models measuring the effect of primers, Ta, PNA, the number of OTUs and the number of reads on the relative abundances of fungal classes and (c) Genera.
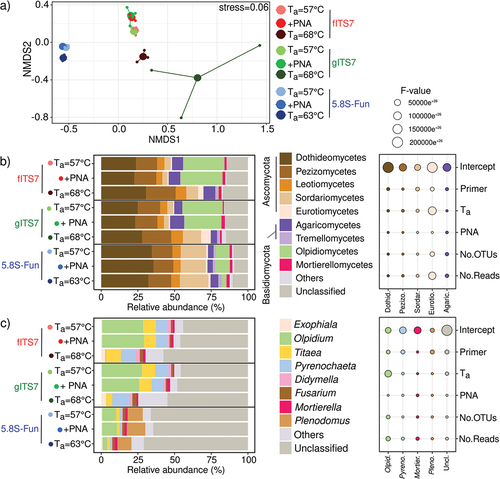
Figure 5. Representative classes and phyla of (a) non-specific or (b–c) specific OTUs of fungal community in Urtica dioica roots according to primer pairs (fITS7/ITS4, gITS7/ITS4, and 5.8S-Fun/ITS4-fun) and conditions used, as well as the number of OTUs corresponding. “Common” corresponds to the OTUs that were found in all PCR conditions with the three primer pairs. “Non-specific” corresponds to the OTUs that were found in at least one condition (Ta = 57 °C; +PNA or Ta = 68–63 °C) of PCR with the three primer pairs.
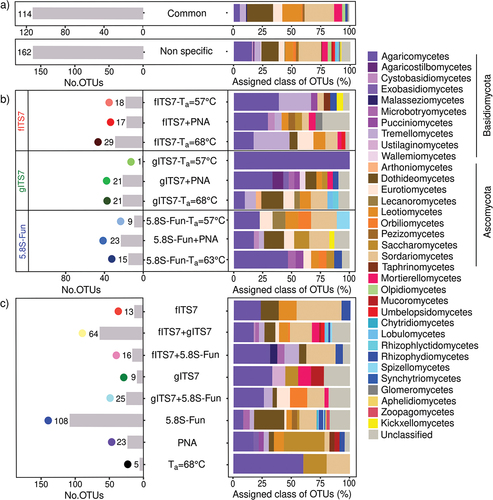
Figure 6. (a) Relative abundance of specific and non-specific OTUs for each primer pair used (fITS7/ITS4: red; gITS7/ITS4: green; 5.8S-Fun/ITS4-fun: blue), with the addition of PNA clamps (+PNA) and a higher annealing temperature (Ta = 68 °C or 63 °C); (b) OTU Bray-Curtis dissimilarity between the different primer pairs (Ta = 57 °C), with or without PNA clamps (+PNA), or with an annealing temperature of 68 °C or 63 °C.
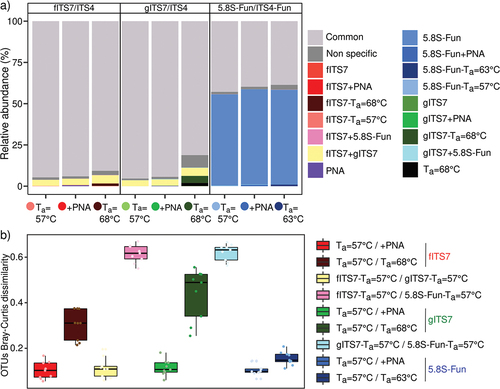
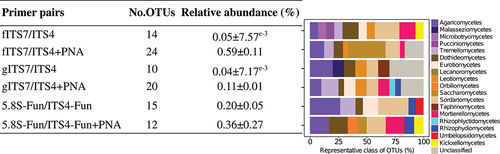
Figure 7. Number of OTUs found in at least two replicates, either without or with the addition of PNA clamps (+PNA), mean relative abundance in percentage ±SE for each primer pair (fITS7/ITS4, gITS7/ITS4, and 5.8S-Fun/ITS4-fun) and the percentage of represented fungal classes.
Supplemental Material
Download Zip (853.9 KB)Data availability statement
Raw sequence data for this project have been submitted to NCBI’s SRA archive under accession no. SUB12918264.