Figures & data
Table 1. Descriptive statistics of measured LAI (m2 m–2) used for validating SNAP-derived LAI.
Figure 1. Scatterplots and associated statistical metrics for observed (in-situ) Leaf Area Index (LAI) against predicted LAI from Sentinel-2 at 10 m (a and b) and 20 m (c and d) using Biophysical processor within SNAP Toolbox. Figure 1(a,c) show observed LAI against predicted LAI from TOA data, while ) show observed LAI against predicted LAI from BOA data.
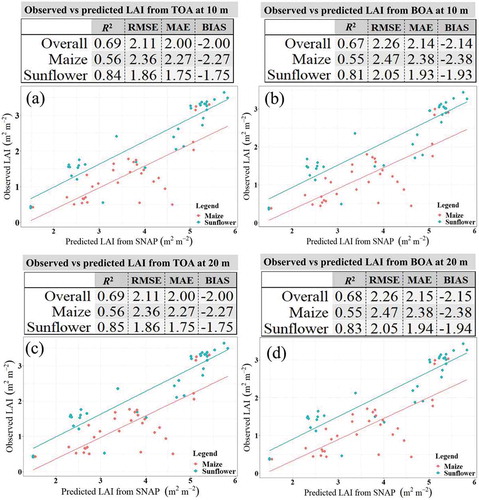
Table 2. Separability metrics for SNAP LAI distributions with MODIS LAI (MCD15A3 H) and Proba-V LAI products at 500 m and 300 m spatial resolutions, respectively. JM-distance values closer to 2 indicate complete separability between LAI values from SNAP and MODIS/Proba-V LAI, while values < 1 indicate poor separability. M-Statistic < 1 indicates poor separability, while M > 1 indicates good separability.
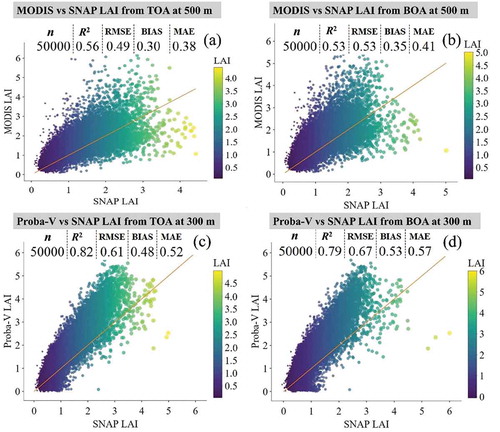
Figure 2. Scatterplots of MODIS LAI (MCD15A3 H) against SNAP-derived LAI at 500 m (a and b), and Proba-V LAI against SNAP-derived LAI at 300 m (c and d). Figure 2(a,c), are results for MODIS/Proba-V LAI against SNAP-derived LAI from TOA data, while Figure 2(b,d), are results for comparison with SNAP-derived LAI from BOA data.