Figures & data
Figure 1. Location of study area in Europe (a) and in the Stubai Valley (b). Land-use pattern for the status quo of the study site ‘Kaserstattalm’ (c).
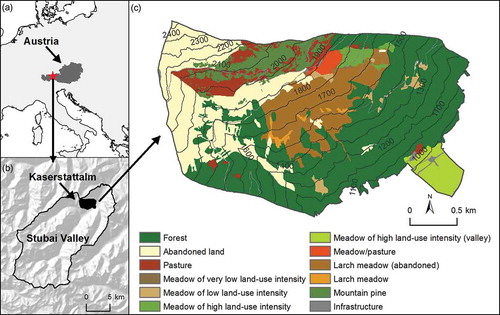
Table 1. Mean annual temperature, annual precipitation and summer precipitation (April–September) of the status quo and scenarios for normal and dry years
Table 2. Land-use distribution of the study area ‘Kaserstattalm’ for historical dates, the status quo and the scenarios
Figure 3. Landscape pattern of ecosystem services for the status quo. Values are re-scaled to 0–100. Historical development and future trends in normalized ecosystem services. All scores are normalized by their status quo levels.
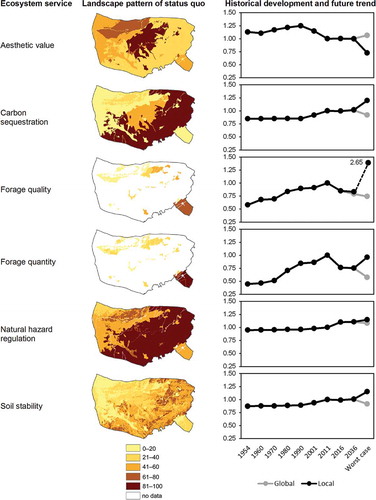
Figure 2. Ecosystem services of different land-use types for the status quo. Values are re-scaled to 0–100.
Table 3. Correlation matrix of PCA for the status quo
Figure 5. PCA plot of eigenvectors (component 1 × component 2) for the status quo.
Figure 4. Maps of contrasts of (a) the first component and (b) the second component for the status quo.
Table 4. Eigenvectors of PCA for the status quo
Supplemental material