Figures & data
Figure 1. Map of the Serengeti ecosystem indicating the protected areas and villages that are contiguous with the Serengeti ecosystem where the survey was conducted. Oval shapes on the map indicate the villages surveyed.
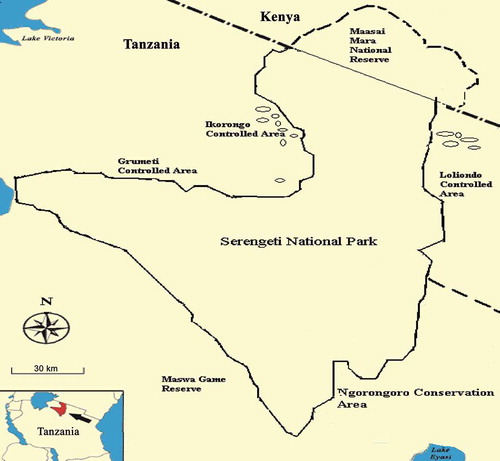
Figure 1. Map of the Serengeti ecosystem indicating the protected areas and villages that are contiguous with the Serengeti ecosystem where the survey was conducted. Oval shapes on the map indicate the villages surveyed.
Please note: Selecting permissions does not provide access to the full text of the article, please see our help page How do I view content?
To request a reprint or corporate permissions for this article, please click on the relevant link below:
Please note: Selecting permissions does not provide access to the full text of the article, please see our help page How do I view content?
Obtain permissions instantly via Rightslink by clicking on the button below:
If you are unable to obtain permissions via Rightslink, please complete and submit this Permissions form. For more information, please visit our Permissions help page.