
Figures & data
Figure 1. Mean number of total Hymenoptera and non-Apis Hymenoptera observed during dry (flowering) seasons for adjacent vs. isolated farms (n = 18, error bars are ±SE). Differences between adjacent and isolated for both groups were statistically significant (t = 2.28, p = .03 for total Hymenoptera; t = 2.40, p = .02 for non-Apis). Different number of asterisks/pound signs denotes significant difference.
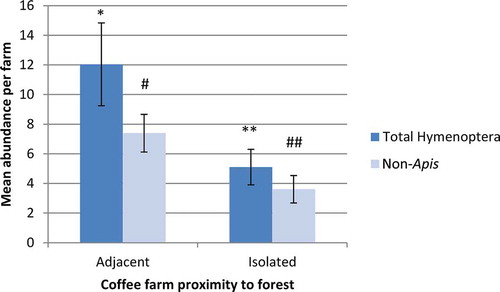
Figure 2. Mean number of total Hymenoptera/non-Apis Hymenoptera observed during rainy (nonflowering) seasons for adjacent vs. isolated farms (n = 12, error bars are ±SE). Differences between adjacent and isolated for neither group were statistically significant (t = −1.97, p = .06 for total Hymenoptera; t = −1.72, p = .10 for non-Apis).
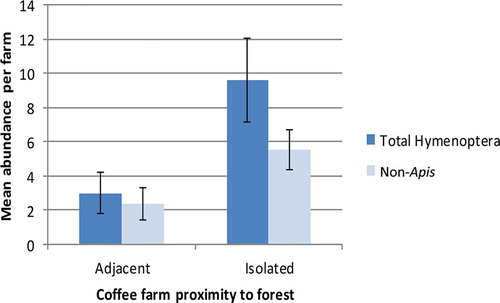
Table 1. Analysis of variance of total hymenopteran observations, with season (dry vs. rainy) and isolation of farm from forest (isolated vs. adjacent) as main effects.
Table 2. Non-Apis Hymenoptera captured in coffee farms during observation periods, by season.