Figures & data
Figure 1. Map showing location of the study sites.
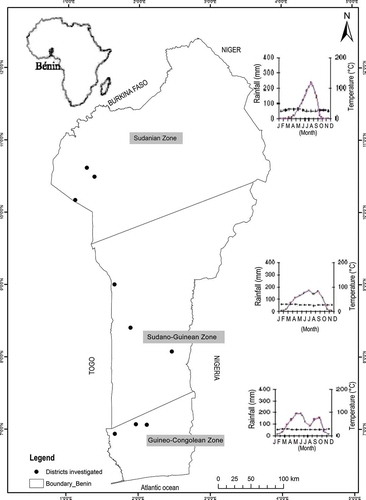
Table 1. Measures of home garden species uses among informants in a phytochorological zone (adapted from Byg and Balslev Citation2001; Monteiro et al. Citation2006).
Table 2. Sociolinguistic characteristics of the informants.
Table 3. Measures of the local use and knowledge on HG species across phytochorological zone.
Table 4. Consensus value for the usage types among informants.
Figure 2. Usage types per age category across phytochorological zones.
Figure 3. Usage types per gender across phytochorological zones.
Table 5. Similarities index of Jaccard (with respect to hosted species by sociolinguistic groups) among the three phytochoria.
Figure 4. Relationships between species ecological importance value index (IVI) and their use value (UV) across phytochorological zones. (a) Guineo-Congolean zone; (b) Sudano-Guinean zone; (c) Sudanian zone.
Table 6. Top 20 species according to ecological importance value (IVI) and use values (UV) in each phytochorological zone.
Figure 5. Most used organs of home garden species per phytochorological zone.