
Figures & data
Figure 1. Map of the study area showing the three different management zones along with the inventory plots.
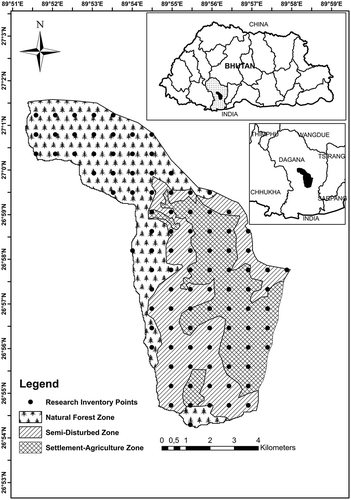
Table 1. Mean, minimum (Min), maximum (Max), and standard deviation (Sd) of (i) site characteristics elevation and slope as wells as (ii) the stand characteristics density, basal area, volume, mean dbh, and mean height.
Table 2. Density (N ha−1) and standard deviation of the tree species in the three zones.
Table 3. Density (N ha−1) and standard deviation of the shrub species in the three zones.
Table 4. Mean values ± standard deviations of density, basal area, and diversity indices for the different zones.
Figure 2. Species richness and diversity: (a) mean number of species per plot, (b) Shannon–Weaver index, and (c) Simpson’s index. Minima, median, maxima, and outliers are indicated. a = Trees (dbh ≥10 cm), b = Saplings (dbh ≥5 to <10 cm), c = Established Seedlings (dbh <5 cm and height >2 m), d = Unestablished seedlings (dbh <5 cm and height <2 m), e = Recruits (current year seedlings).
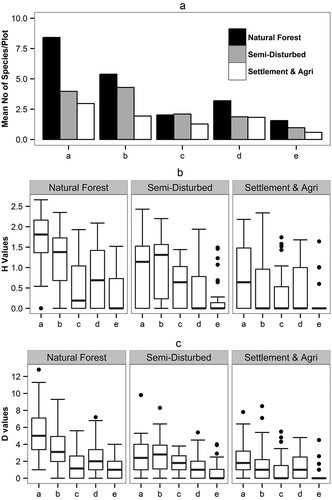
Figure 3. Mean Shannon–Weaver biodiversity values of trees, saplings, and seedlings grouped by quadratic mean dbh class of trees. (a) Trees (dbh ≥10 cm), (b) saplings (dbh ≥5 to <10 cm), and (c) established seedlings (dbh <5 cm and height >2 m).
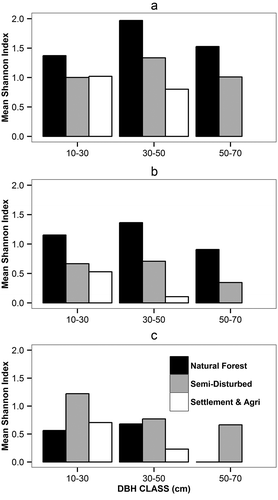
Figure 4. Diameter distribution of timber and non-timber species across the three zones. (a) Timber species distribution, (b) timber species above dbh class of 40 cm, (c) non-timber species distribution, and (d) non-timber species of dbh above 40 cm. * dbh of 40 cm and above are usually cut for timber.
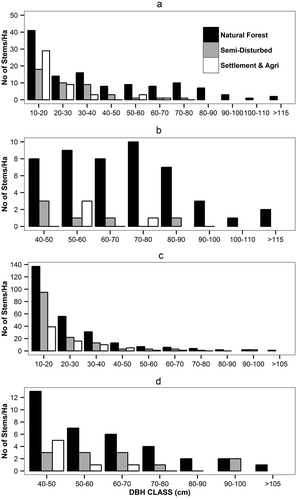
Figure 5. Basal area for the timber species across the three zones: (a) basal area/ha and (b) basal area/ha (plots below 2000 m.a.s.l). a = Acer spp., b = Alnus nepalensis, c = Castanopsis spp., d = Cinnamomum spp., e = Michelia spp., f = Persea spp., g = Phoebe spp., h = Quercus spp., i = Schima wallichi, j = Syzigium spp, k = Terminalia myriocarpa, l = Toona ciliata.
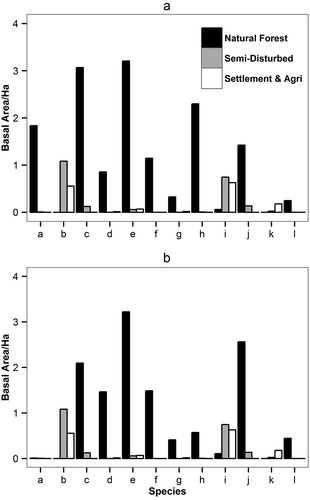
Table 5. Density (N ha−1) ± standard deviation of saplings and seedlings for the different zones.
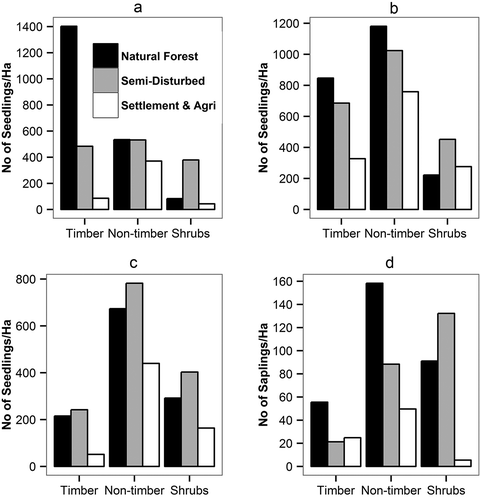
Figure 6. Seedling and Sapling density (N ha−1) of the timber, non-timber and shrub species across the three zones. (a) Recruits (current year seedlings), (b) Unestablished Seedlings (dbh <5 cm and height <2 m), (c) Established Seedlings (dbh <5 cm and height >2 m), and (d) Saplings (dbh ≥5 to <10 cm).
Table