
Figures & data
Figure 1. Locations of the 25 urban community gardens sampled in the California central coast from San Jose to Monterey.
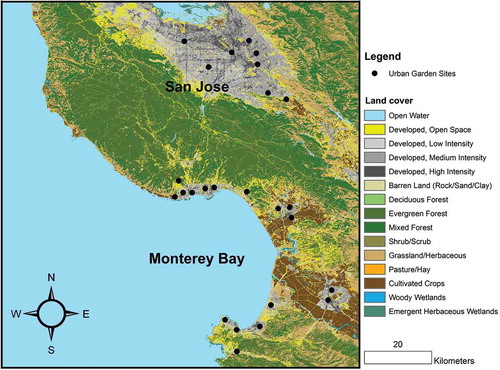
Table 1. Regional Opportunity Index domains, their indicators, and minimum, maximum, and mean values across the 25 sites.
Table 2. Minimum, maximum and mean values for all soil properties and groundcover management characteristics measured for the 25 gardens.
Figure 2. Mulch groundcover management strongly predicted soil properties including: (a) soil organic matter (%) (SOM; P = 0.04), (b) water holding capacity (WHC; P = 0.04), and (c) soil carbon (Wt%) (P = 0.05). In turn, neighborhood opportunity domains predicted the amount of mulch cover (d, e, f). Grey areas represent 95% confidence bands.
Table 3. Results from linear mixed-effects models of soil properties and selected groundcover management (mulch) predicted by Regional Opportunity Index (ROI) factors (significant factors in bold).
Figure 3. Soil structure and nutrient properties versus socio-demographic characteristics that were the strongest socio-demographic predictors in the mixed-effects analysis. Neighborhood opportunity domains predicted: bulk density (a, d), soil organic matter (%) (SOM; b, e), and soil C:N ratio (c, f). Grey areas represent 95% confidence bands.
Figure 4. Ordinations of garden study sites determined by the 6 soil properties examined in relation to groundcover management (a), and socio-demographic characteristics of garden neighborhoods (ROI domains; b).
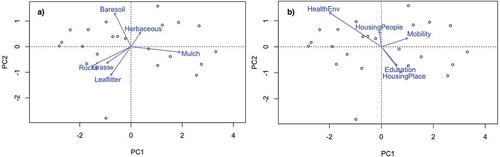
Table A1. Overview of the urban community gardens sampled in this study: region (County), garden name, management structure, typology, size in acres, age in years, and soil parent material classified by the National Resources Conservation Services.
Table A2. Results from the Pearson’s Correlation Analysis examining the ROI domains for collinearity.
Table A3. Pairwise correlation matrix among groundcover management variables.
Table A4. Results from best fit generalized linear models model selection. Most soil properties were best explained by mulch cover.
Table A5. Model fit for models predicting soil properties and groundcover management by socio-demographic variables (i.e., ROI domains) as fixed effects versus those without (i.e., null models with only random effects).
Table A6. Results from all linear mixed-effects models in which neighborhood opportunity characteristics were the explanatory variables, and soil properties and groundcover management were the response variables.
Table A7. Principle components analysis loadings for groundcover characteristics (top) and socio-demographic characteristics (i.e., ROI domains) measured in the gardens.