Figures & data
Figure 1. The study area, Cumberland and Colchester counties of Nova Scotia, Canada, including the sites where field data were collected in the summer of 2015.
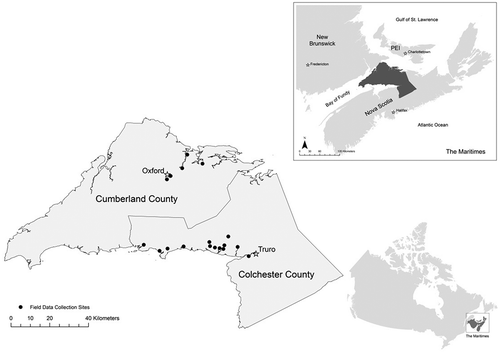
Figure 2. The layout of plots (circles) along transects surrounding an apiary within a 1-km radius.
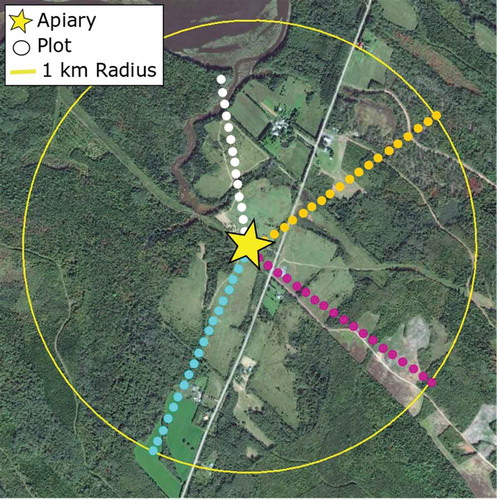
Table 1. Modified Daubenmire method for evaluating vegetation percentage cover.
Figure 3. Results of the InVEST modelling for the potential abundance of honey bees in Cumberland and Colchester counties of Nova Scotia. The model uses an LULC raster (a), a table of land -cover attributes (one iteration was informed by the literature and one was informed by field work) and a table of pollinator species as inputs to derive maps of nesting suitability (b) and floral resources (c). Combining (b) and (c) using Equation (1) generates an index of potential pollinator abundance on the landscape (d). Two iterations of the model were run, one informed by proxies and approximate values from the literature (i) and the other by field work (ii).
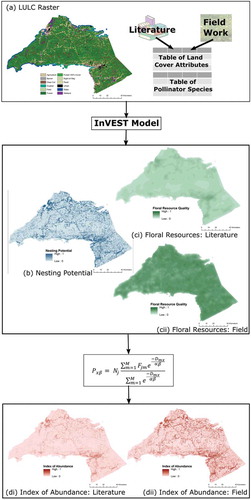
Figure 4. Results of a subtraction between the results of the field-based InVEST model and the results of the literature-driven iteration.
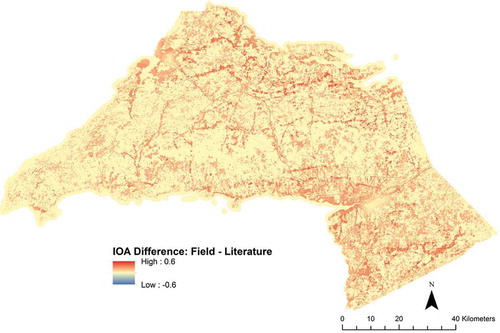
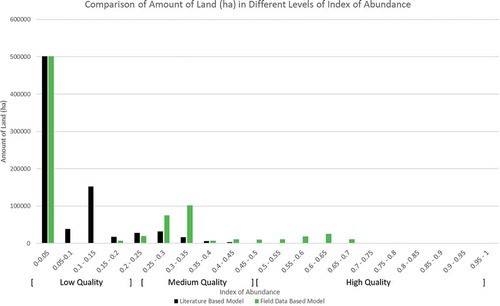
Figure 5. Comparison of the amount of land in different levels of the index of abundance generated by the analysis informed by literature and field-based data.