Figures & data
Figure 1. Map of the New Forest National Park showing management units in grey and surveyed car park locations marked in red (derived from Ordnance Survey data © Crown copyright and database right 2016).
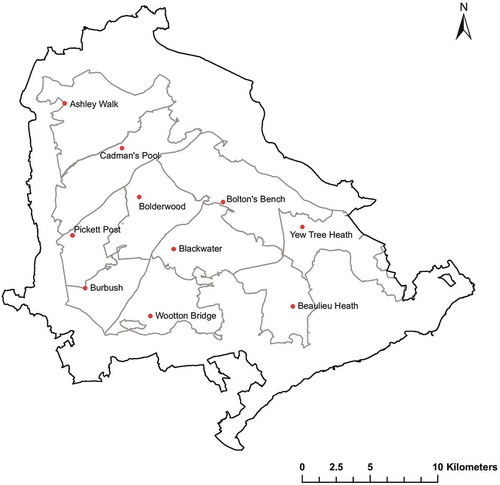
Figure 2. Bar charts illustrating the mean preference for (a) recreation value (b) aesthetic value for habitats, using a survey method. The overall difference between the median ranks of habitats was significant for (b) recreation value and (b) aesthetic value. Bars grouped by the same letter are not significantly different from each other (pairwise comparisons, p < 0.05, without Bonferroni correction).
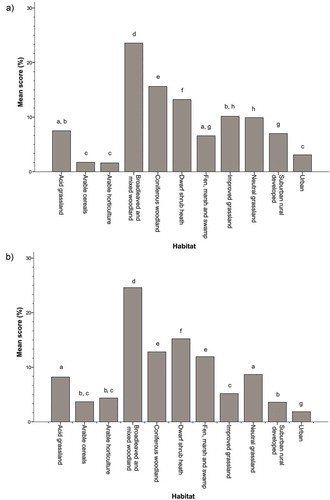
Figure 3. Bar charts illustrating the mean percentage of (a) recreation value and (b) aesthetic value, using participatory GIS. The overall difference between the median ranks of habitats was significant for (a) recreation value and (b) aesthetic value. Bars grouped by the same letter are not significantly different from each other (pairwise comparisons, P < 0.05, without Bonferroni correction).
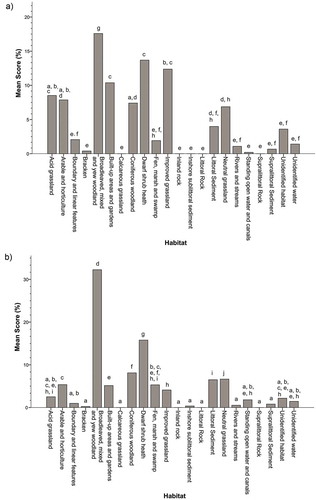
Figure 4. Bar chart illustrating the mean percentage of recreation value using GPS tracking. The overall difference between the median ranks of habitats was significant. Bars grouped by the same letter are not significantly different from each other (pairwise comparisons, P < 0.05, without Bonferroni correction).
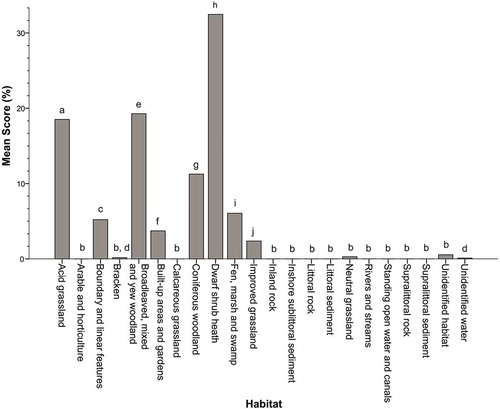
Table 1. Area of habitat types within the study area and the normalised mean (between 0 and 1) value for recreation and aesthetic values for each method utilised.
Table 2. Spearman rank correlations between all methods utilised for recreation and aesthetic value assessment using two-tailed tests. Unity-based normalisation was used on the means for each habitat type for each method before testing. To compare the survey method, the ‘arable cereals’ and ‘arable horticulture’ classes were combined and the classes ‘Urban’ and ‘Suburban rural developed’ were combined. Values in bold are statistically significant.
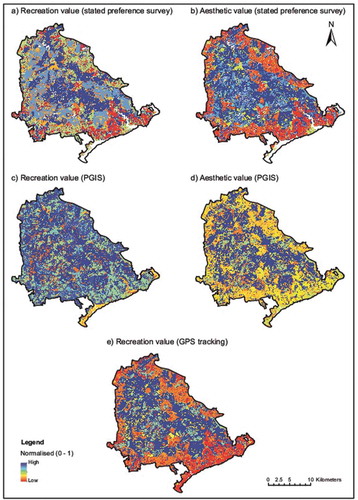
Figure 5. Habitat maps based on the Hampshire Biodiversity Information Centre (HBIC) at a 25 × 25m resolution, displaying the normalised mean value for each habitat for recreation value (a, c, e) and aesthetic value (b, d), by method: structured survey (a, b), PGIS (c, d) and GPS tracking (e). Areas shown as white (a, b) were not included in the list of habitats presented to participants for this method, hence have not been included.