
Figures & data
Figure 1. Map showing location of the study site and the placement of sampling plots.
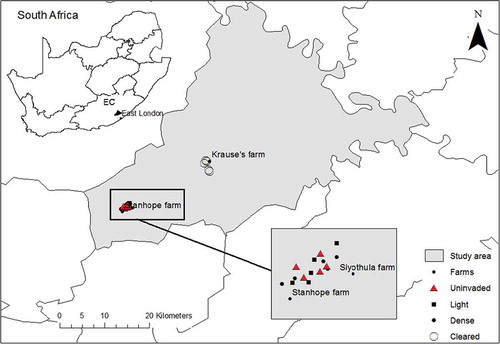
Figure 2. Mean percent basal cover ± SE for ecological groups in uninvaded (n = 5), lightly invaded, (n = 5), dense invaded (n = 5) and cleared (n = 5) sites in the Amathole Montane Grassland of Stutterheim, Eastern Cape (F = 6.62, p < 0.000) .
Table 1. Means ± SE values of infiltration rate and layer properties in uninvaded (n = 5), lightly invaded (n = 5), dense invaded (n = 5) sites and cleared (n = 5) in the Amathole Montane Grassland of Stutterheim, Eastern Cape.
Figure 3. Average percent moisture content ± SE for difference sites: for uninvaded (n = 5), lightly invaded, (n = 5), densely invaded (n = 5) and cleared (n = 5) sites in the Amathole Montane Grassland of Stutterheim, Eastern Cape. All differences are significant at p < 0.05, Games Howell Post-Hoc test (F = 5.40, p < 0.01) .
Table 2. Mean percent content ± SE for soil chemical properties in uninvaded (n = 5), cleared (n = 5), lightly invaded (n = 5) and dense invaded (n = 5) sites in the Amathola Montane Grassland of the Eastern Cape.
Figure 4. Mean grazing capacities ± SE for uninvaded (n = 5), lightly invaded, (n = 5), densely invaded (n = 5) and cleared (n = 5) sites in the Amathole Montane Grassland. All differences are significant at p < 0.05, Games Howell Post-Hoc test (F = 14.84, p < 0.05).
Table 3. Mean range condition scores ± SE for different species in uninvaded (n = 5), lightly invaded, (n = 5), densely invaded (n = 5) and cleared (n = 5) sites in the Amathole Montane Grassland of Stutterheim, Eastern Cape.