Figures & data
Figure 1. Conceptual approach for calculating the economic value of site quality in forest.
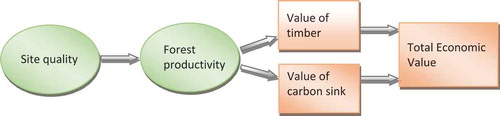
Table 1. Descriptive statistics.
Table 2. Regression results from fully modified ordinary least square (FMOLS) of growth rate and variance in forest productivity for Sweden (t-values in brackets).
Figure 2. Expected benefits and costs of risk for timber and carbon sequestration at different levels of site quality, SEK/ha.
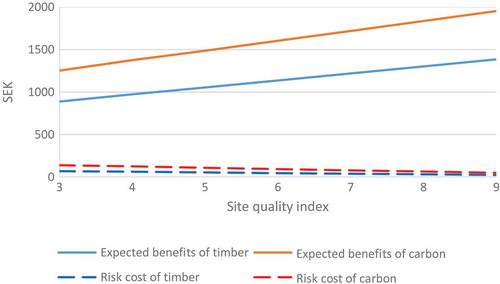
Table 3. Calculated total economic value and average contribution of a one-unit increment in site quality to the total economic value of timber and carbon sequestration, SEK/ha.
Figure 3. Economic value of the contribution of increasing site quality by one unit for different prices of timber and carbon sequestration, and risk aversion, SEK/ha. See Table A1 for the data.
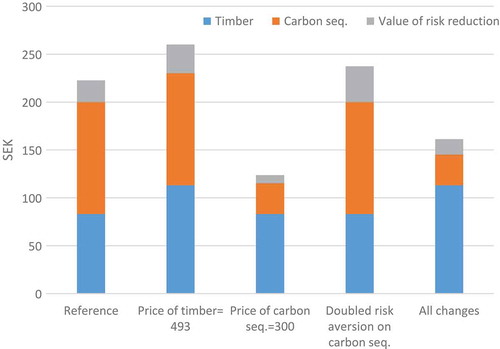
Table A1: Calculated total economic value and average contribution of a one-unit increment in site quality to the total economic value of timber and carbon sequestration for changes in prices of timber (PT), carbon sequestration (PC), and risk aversion, SEK/ha.
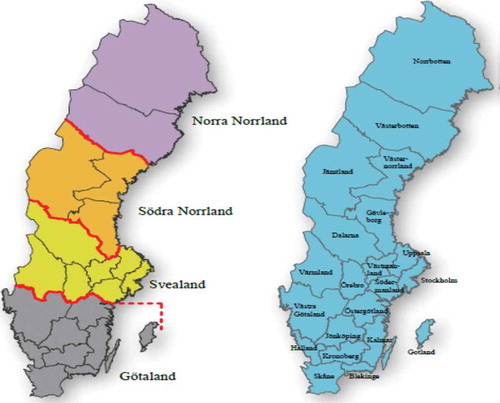
Source: Swedish Forest Data, 2014 report. Department of Forest Resource Management, SLU NB: Norra and Södra Norrland are North and South Norrland, respectively.