Figures & data
Table 1. Results of papers comparing ecosystem services delivered by rewilding land management relative to alternative baseline land management strategies/land uses. ↑/-/↓ correspond to an increase/no change/decrease in ecosystem services respectively. All papers listed assess the total level of ecosystem service delivery except Birch et al. (Citation2010) which assesses the net present value of ecosystem service changes including restoration costs.
Figure 1. Map of the study area and location of the study sites. Unbroken lines represent the outlines of the exclosures. Dashed lines represent the boundaries of the sites chosen as adjacent controls. Black squares represent the locations of individual sample plots.
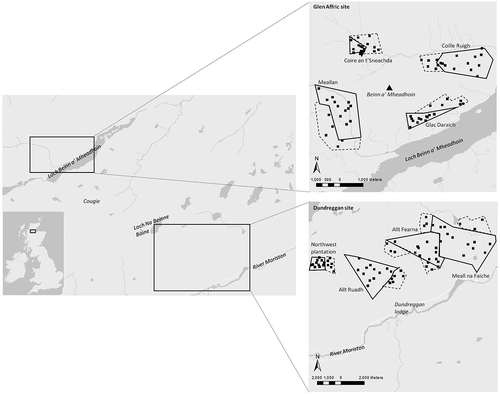
Table 2. Categorisation of continuous variables representing alternative landscape attributes. Adapted from Arriaza et al. (Citation2004).
Table 3. Value of provisioning services and aboveground biomass within the exclosures at each site. Standard errors given in brackets next to values. Meall na Faiche was the only site at which the mean woody biomass/hectare in control sites was non-zero (mean = 35.12, standard error 5.85).
Figure 2. Outputs of linear models describing: A: Predicted pollinator visits as a function of time since rewilding (rewilding was an insignificant predictor of pollination visitation). B: Predicted log aboveground woody biomass as a function of time since rewilding, with all other model variables held at their mean values. C: Predicted photo mean visual quality as a function of time since rewilding, with all other model variables held at their mean values.
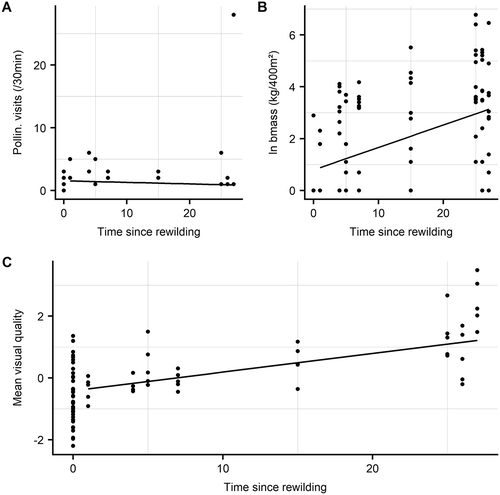
Figure 3. Mean visual quality score assigned by different stakeholder groups to photos representing different rewilding age classes. Lines denote standard errors.
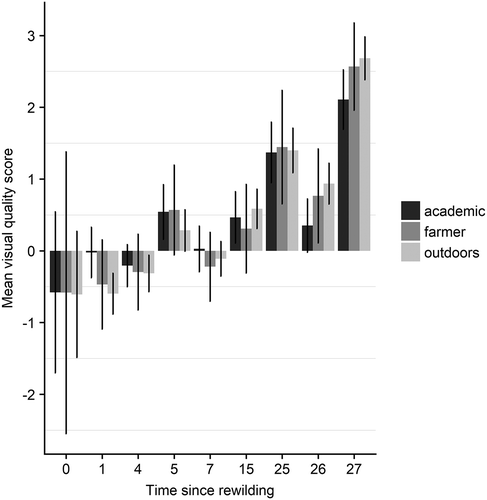
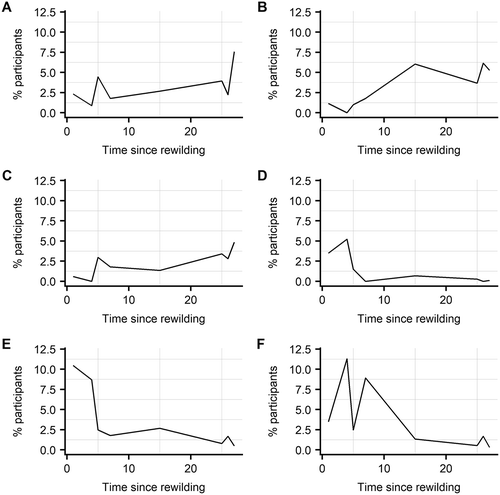
Figure 4. Percentage of participants using adjectives in their descriptions of rewilding plots along the chronosequence: A) Alive; B) Beautiful; C) Wild; D) Uninspiring; E) Boring; F) Bland.