Figures & data
Figure 1. Study area: peatland region in NE-Germany. The 49 sampled peatlands are indicated as black dots.
Figure 2. Frequency distribution of (a) minimum age (n = 48), (b) depth (n = 49), (c) resolution (n = 48), (d) incompleteness (n = 49), (e) evenness (n = 49), and (f) substrate diversity (n = 49).
Figure 3. Cumulative thickness of each substrate type per profile displayed in box-and-whisker plots including colour signature used in the following figures. Fh = organic gyttja, Fm = silicate gyttja, Fm.lamin = laminated sediments, Hkha = Scheuchzeria peat, Hkhe = Eriophorum peat, Hkrc = sedge peat, Hkrp = Phragmites peat, Hl = woodpeat, Hmb = brown-moss peat, Hms = Sphagnum peat Hz = degraded peat, S = sand, W = water.
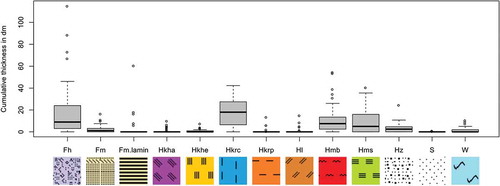
Figure 4. Ward hierarchical clustering using cumulative thickness of 11 substrate types and peatland depth as attributes. Data not standardized. *threatened peatlands.
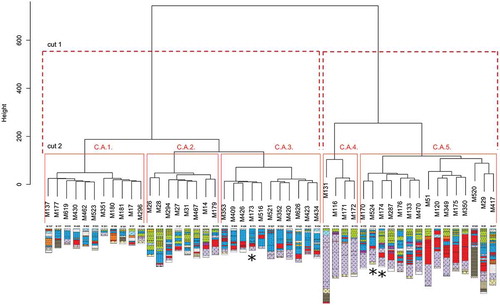
Figure 5. Dissimilarities (sum of Euclidean distances) from one peatland to all other peatlands using cumulative thicknesses of 11 substrate types and depth as attributes. *threatened peatlands.
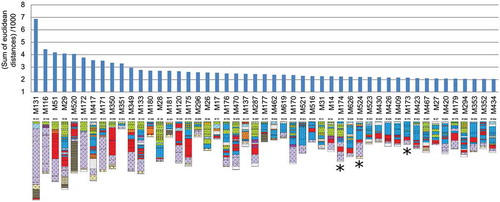
Figure 6. Radar charts visualizing the archive loss in case the peatlands M137, M131, and the three threatened peatlands (M173, M174, M524) are removed from the total regional peatland population. Each ray represents the sum of all scores from all peatlands for that particular attribute (=100 %). Removal of M173, M174, and M524 would, for example, have no effect on the regional amount of laminated sediments (Fm.lamin), Phragmites peat (Hkrp), or wood peat (Hl), but would cause a loss of 15.48 % of Scheuchzeria peat (Hkha) and 11.45 % of Eriophorum peat (Hkhe). Divers = diversity of substrates; complete = completeness; even = evenness; resolut = resolution; min.age = minimum age; accum = accumulation status. Other abbreviations are defined in caption of . Mind the exaggerated display of scores.
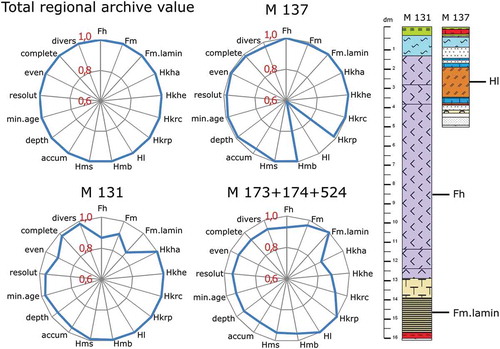
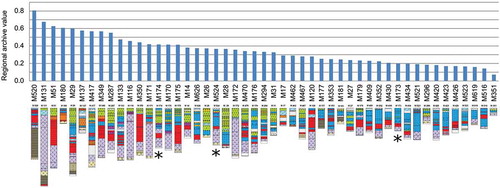
Figure 7. The archive value ranking of the 49 peatland archives (in %). Archive value (y-axis) of each peatland was determined by summing up all proportional contributions to the regional archive for 17 criteria: age, depth, resolution, accumulation status, completeness, evenness, diversity, and cumulative thickness of 10 individual substrate types. *Threatened peatlands.