Figures & data
Figure 1. Schematic overview of the different experiments. In all experiments we investigated the effects of threat manipulation on agent detection. In Experiments 1a and 1b, threat was manipulated by presenting pictures of the international affective picture system; in Experiments 2a, 2b (between-subjects), and 3, threat was manipulated by presenting horror music; in Experiment 4, threat was manipulated by means of a virtual reality horror scenario. In Experiments 1 and 2, we used a Biological Motion Detection Task as our dependent measure; in Experiment 3, we used a Geometrical Figures Task as our dependent measure; in Experiment 4, we used an Auditory Agent Detection Task as our dependent measure.
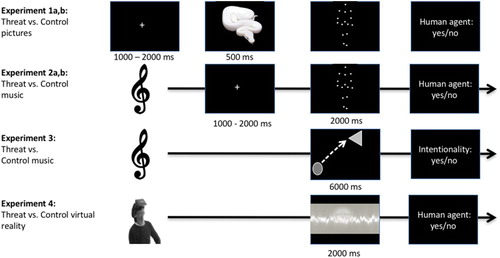
Figure 2. (a) Response bias (left graph) and perceptual sensitivity (right graph) as a function of the number of visual distractors in Experiment 1a. The dark lines represent the threat condition (i.e., trials preceded by threatening pictures of the IAPS) and the light line represents the control condition (i.e., trials preceded by arousal controlled pictures of the IAPS). Error bars represent 95% confidence intervals. (b) The response bias (c; left graph) and perceptual sensitivity (d’; right graph) as a function of the number of visual distractors in Experiment 1b. The dark lines represent the threat condition (i.e., trials preceded by threat pictures of the IAPS) and the light lines represent the control condition (i.e., trials preceded by valence controlled pictures of the IAPS). Error bars represent 95% confidence intervals.
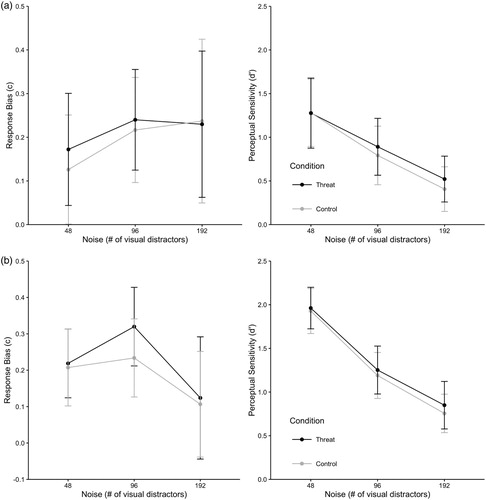
Figure 3. (a) The response bias (c; left graph) and perceptual sensitivity (d’; right graph) as a function of the number of visual distractors in Experiment 2a. The dark lines represent the threat condition (i.e., classical horror music) and the light lines represent the control condition (i.e., elevator music). Error bars represent 95% confidence intervals. (b) The response bias (left graph) and the perceptual sensitivity (right graph) as a function of the number of visual distractors in Experiment 2b. The dark lines represent the threat condition (i.e., trials run in the context of threatening music) and the light line represents the control condition (i.e., trials in the context of neutral music). Error bars represent 95% confidence intervals.
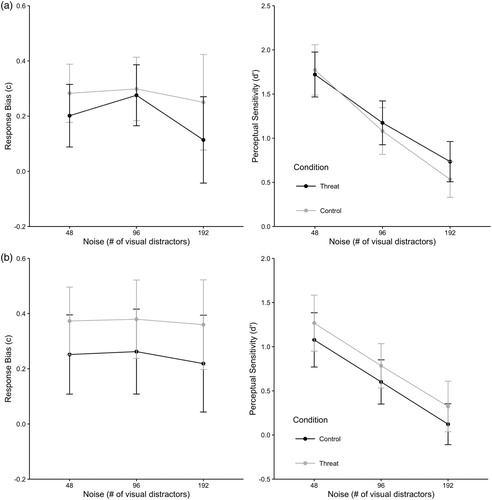
Figure 4. Response bias (left graph) and perceptual sensitivity (right graph) as a function of the type of condition (threat vs. control) in Experiment 3. The dark lines represent the difference between the threat condition (i.e., threatening music) and the control condition (i.e., neutral music). Error bars represent 95% confidence intervals.
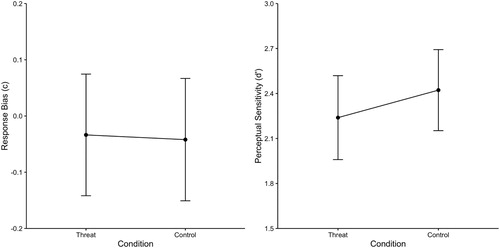
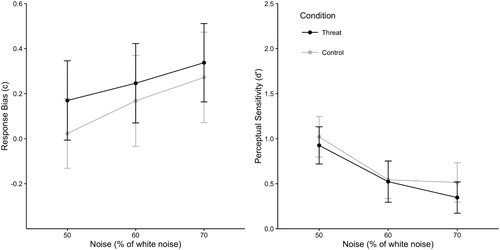
Figure 5. The response bias (left graph) and perceptual sensitivity (right graph) as a function of the percentage of white noise in Experiment 4. The dark lines represent the threat condition (i.e., threatening virtual reality scenario) and the light lines represent the control condition (i.e., neutral virtual reality scenario). Error bars represent 95% confidence intervals.