1,118
Views
2
CrossRef citations to date
0
Altmetric
Article

Mapping the minds of spectators during an extreme ritual: a network perspective

ORCID Icon, , & ORCID Icon
Pages 4-22 | Received 02 Mar 2022, Accepted 19 Jan 2023, Published online: 10 Mar 2023

Figures & data

Figure 1. Spectators reactions during extreme ritual. While past research has examined ritualistic effects on high ordeal performers & their closest kin (center panel) (e.g., Konvalinka et al., Citation2011; Xygalatas, Mitkidis, et al., Citation2013), little is known about the cognitive and emotional reactions of observing participants in response to the ritual (left and right panel).

Figure 1. Spectators reactions during extreme ritual. While past research has examined ritualistic effects on high ordeal performers & their closest kin (center panel) (e.g., Konvalinka et al., Citation2011; Xygalatas, Mitkidis, et al., Citation2013), little is known about the cognitive and emotional reactions of observing participants in response to the ritual (left and right panel).

Figure 2. Network structure of psychological reactions during an extreme ritual. Overall network structure based on Extended Bayesian Information Criterion Gaussian Least Absolute Shrinkage and Selection Operator (EBICglasso; Foygel & Drton, Citation2010) network analysis and bootstrapped Exploratory Graph Analysis (EGA) (Epskamp & Fried, Citation2018) using a walktrap algorithm (Yang et al., Citation2016) with 1,000 bootstrap samples. Node colors indicate community membership according to EGA (see the right-hand legend). Node size indicates the expected influence (2-step, including indirect influence) on communities outside the node’s community, while node shape indicates direction of expected influence (circle – positive, square – negative). Green lines indicate positive edges between individual nodes, and red edges indicate negative edges between individual nodes. MDS stress = .13. For interpretation purposes, the axes are rotated 15° anticlockwise. Full statistical information is provided in the supplement (see Tables S3–S7).

Figure 2. Network structure of psychological reactions during an extreme ritual. Overall network structure based on Extended Bayesian Information Criterion Gaussian Least Absolute Shrinkage and Selection Operator (EBICglasso; Foygel & Drton, Citation2010) network analysis and bootstrapped Exploratory Graph Analysis (EGA) (Epskamp & Fried, Citation2018) using a walktrap algorithm (Yang et al., Citation2016) with 1,000 bootstrap samples. Node colors indicate community membership according to EGA (see the right-hand legend). Node size indicates the expected influence (2-step, including indirect influence) on communities outside the node’s community, while node shape indicates direction of expected influence (circle – positive, square – negative). Green lines indicate positive edges between individual nodes, and red edges indicate negative edges between individual nodes. MDS stress = .13. For interpretation purposes, the axes are rotated 15° anticlockwise. Full statistical information is provided in the supplement (see Tables S3–S7).

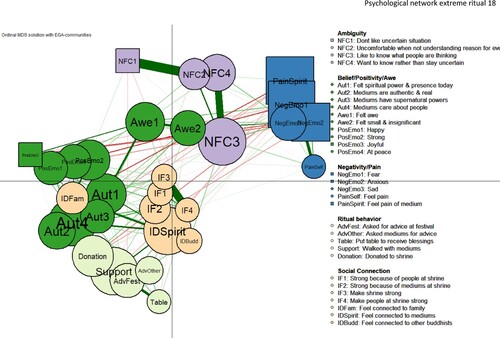
Table 1. Main findings and implications of the network findings in spectators for ritual theory.

Supplemental material

supplement.revised.rev2-RBB-dec12.docx

Download MS Word (15.8 MB)