Figures & data
Figure 1. (a) Distribution of responses to question “Does prayer help you understand a problem you are facing?”; (b) Distribution of responses to question “How often does praying about a problem change the way you see it?”
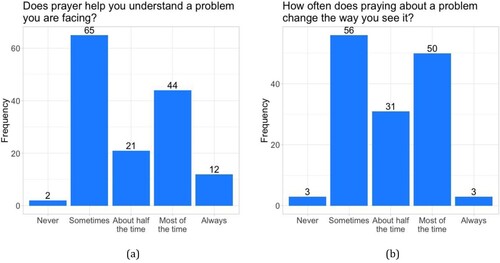
Figure 2. (a) Distribution of responses to question “How often do you feel like praying gives you a clear sense of what action you should take after you pray?”; (b) Distribution of responses to question “How often does prayer help you resolve conflict with someone else?”
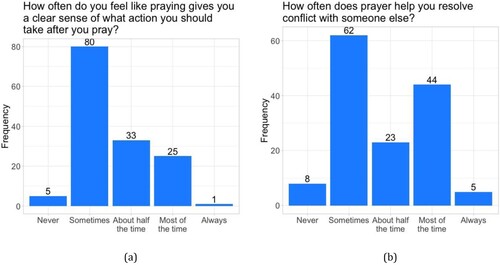
Figure 3. (a) Distribution of responses to question “Does prayer feel like talking something over with someone else?”; (b) Distribution of responses to question “Does prayer ever feel like talking to yourself?”
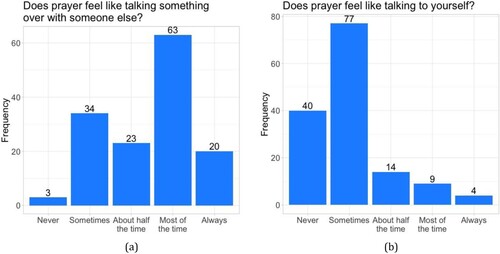
Figure 4. (a) Distribution of responses to question “When you are praying, how often do you “give it to God”—i.e., relinquish responsibility over the problem (or parts of the problem) you are praying about?”; (b) Distribution of responses to question “How often do you feel a sense of relief after you pray?”
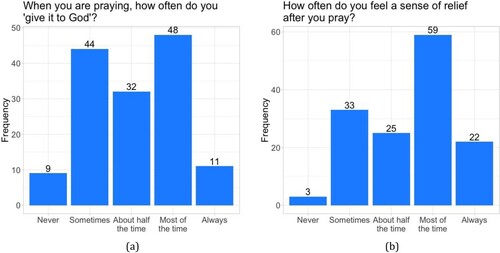
Table 1. The breakdown of Christian denomenation types in the experiment sample with how many participants were in each group.
Figure 5. (a) Distribution of participant responses to statement “I feel a sense of relief after praying/thinking about the situation.” Dashed lines show the median response for each condition. (b) Posterior distribution of differences of means between conditions from BEST on relief measure.
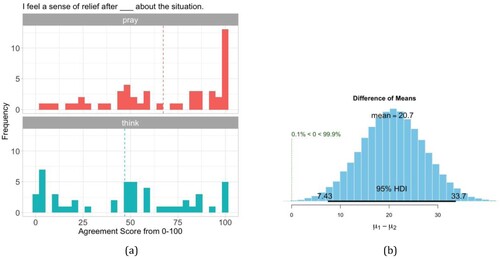
Figure 6. (a) Distribution of participant responses to statement “I think something will change with this person as a result of praying/thinking about the situation.” Dashed lines show the median response for each condition. (b) Posterior distribution of differences of means between conditions from BEST on result measure.
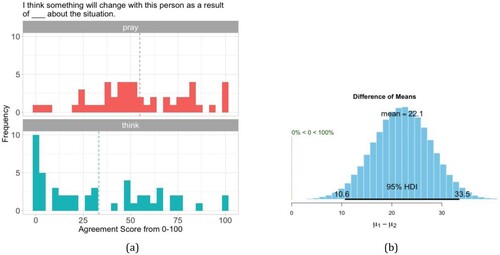
Figure 7. (a) Distribution of participant responses to statement “I feel more connected to the person after praying/thinking about the situation.” Dashed lines show the median response for each condition. (b) Posterior distribution of differences of means between conditions from BEST on connectedness measure.
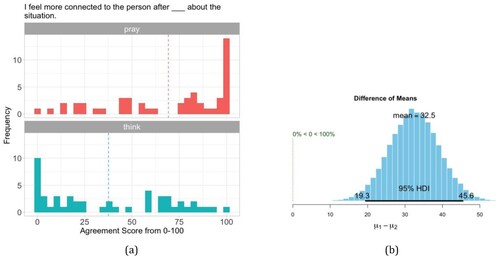
Figure 8. Mean responses for each question asked in the experiment in Study 3, by condition. This Cleveland plot shows the average difference between conditions, item by item, ordered by the magnitude of the difference. The measure of connection (“I feel more connected to the person after praying/thinking about the situation.”) had the largest difference between conditions, and the measure of the importance of religion to the participant had the least difference.
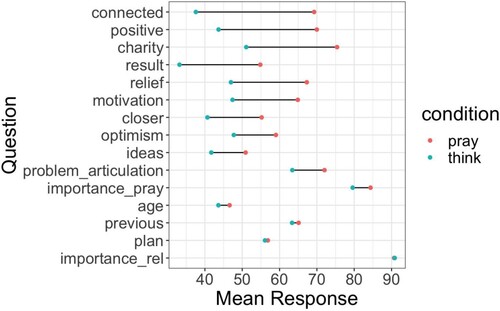
Figure 9. Model fits by condition for the measure “I think something will change with this person as a result of praying about the situation.” The x-axis shows the age of participants, scaled for the purposes of modeling. The true age range of the x-axis is from 18-95. The y-axis shows participants’ responses to the measure “I think something will change with this person as a result of praying/thinking about the situation.” The lines show Bayesian regression model fits.
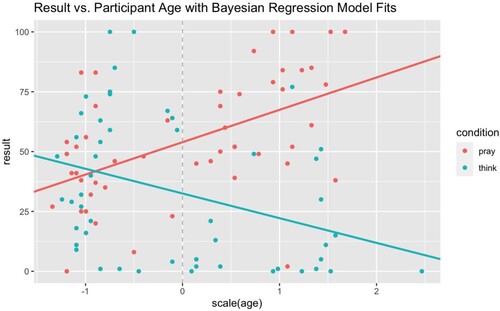
Figure B1. Correlation of items in the survey.
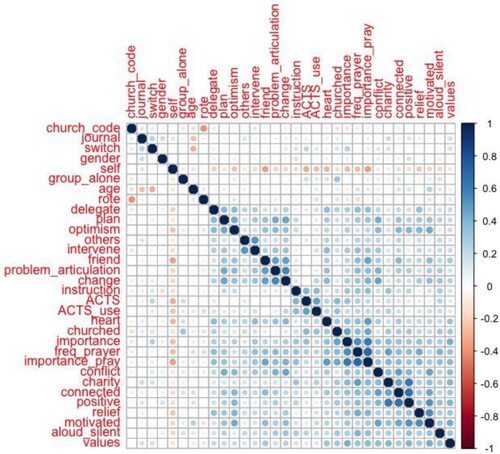
Table B2. This table shows the loadings on the first and second components of a principal component analysis, ordered from largest to smallest on the first loading. The three largest positive loadings are highlighted in each component.
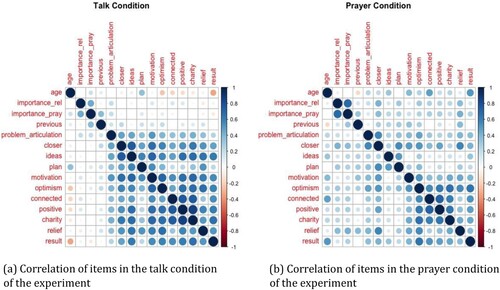
Figure C1. (a) Correlation of items in the talk condition of the experiment; (b) Correlation of items in the prayer condition of the experiment