Figures & data
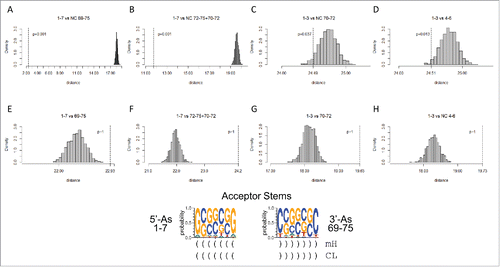
Figure 1. The tRNA structure. The 7-nt paired As are green (5′-As: 1–7; 3′-As: 69–75). The 5-nt As* are cyan (D loop 25–29 and V loop 47–51). The homologous Ac and T loop 17-nt microhelices are red (Ac loop: 30–46; T loop: 52–68). The D loop 17-nt microhelix is magenta (8–24). 3′-CCA is white. Blue dots indicate the anticodon (37–39). Blue and orange dots indicate stacked bases (37–41) in the Ac loop. Yellow dots indicate elevated base 61 (loop nt 5) and flipped out bases 62 and 63 (loop nts 6 and 7) in the T loop. G19 and G20 (magenta) and C59 (red) that help form the elbow are indicated. Homologous Ac and T loops are numbered for loop positions (1–7). Numbering is based on a 75-nt cloverleaf tRNA core ().
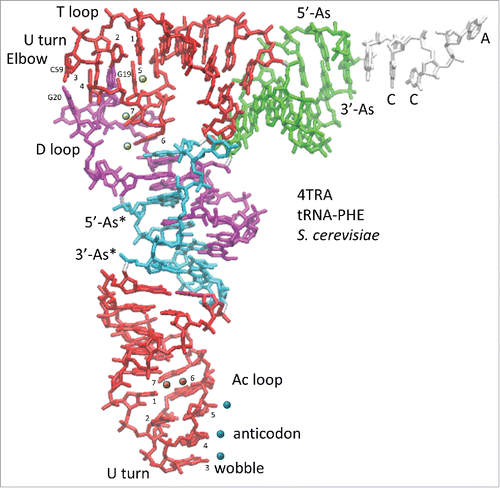
Figure 2. “Typical” cloverleaf diagrams. (A) Pyrococcus (archaeal) tRNAs (three species). (B) Archaeal tRNAs. (C) Bacterial tRNAs.Citation3 Only 5 nts of the V loop (47–51) are considered (red line) in the model because additional nts result from inserts. The model is numbered for a 75-nt core, neglecting the 3′-CCA, where the amino acid is covalently attached.Citation1 A previous 72-nt numbering system was based on tRNAs with 3 nt deletions in the D loop. In (B) U-turns are indicated. D loop G19 and G20 interactions with the T loop are shown. Blue dots indicate the anticodon (37–39). Orange dots indicate stacked bases in the Ac loop (40–41). Yellow dots indicate elevated base 61 and flipped out bases 62 and 63 in the T loop (loop positions 5–7) (colored dot labels as in ).
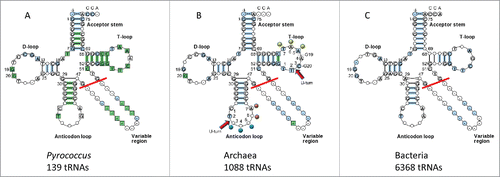
Figure 3. A model for cloverleaf tRNA evolution. Three 31-nt minihelices are ligated to form a 93-nt precursor. Two symmetric 9 nt deletions within ligated acceptor stems generate the 75-nt tRNA core. Colors as in . Parentheses indicate base pairing. Asterisks indicate unpaired bases. / indicates a U-turn. / indicates no U-turn.
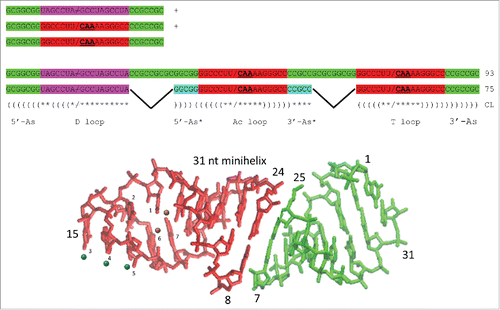
Figure 4. Comparisons of 17-nt microhelix structures and their interactions. (A) Comparison of an Ac loop and a T loop. Overlay of Saccharomyces cerevisiae tRNAPHE Ac and T loops (PDB 4TRA). Loop positions are numbered. The Ac loop was colored for chemistry. The T loop is transparent white. Two views. (B) Interactions of the D loop with the T loop. The paired stem is green. The 7-nt T loop is white. The D loop is colored for chemistry. (C) Comparison of an Ac loop from a ribosome- and mRNA-bound tRNA (5DOY_W) (A site; colored for chemistry) and an Ac loop from an unbound tRNA (4TRA) (transparent white). Two views. (D) Overlay of an Ac loop from a P site (colored for chemistry) and an Ac loop from an A site (transparent white) tRNA. Two views. Blue dots indicate anticodon positions. Orange dots indicate stacked bases 6 and 7 of the Ac loop. Yellow dots indicate elevated base 5 and flipped out bases 6 and 7 in the T loop (A and B only). RMSD is for backbone atoms.
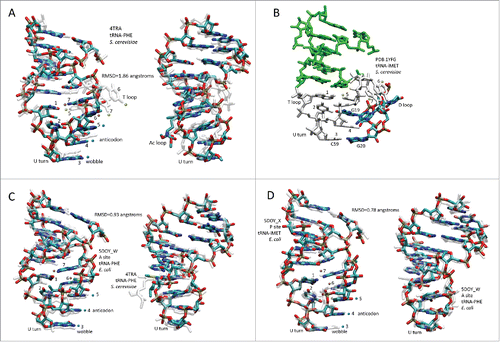
Figure 5. Homology of acceptor stems and acceptor stem remnants. The dotted line indicates the observed alignment evolutionary distance score. The gray histogram indicates 1000 randomly permuted sequences of the same base composition. In the sequence logo, blue arrows indicate homologous positions. Parentheses indicate base pairing. Asterisks indicate loops. mH indicates minihelices or microhelices. CL indicates cloverleaf fold.
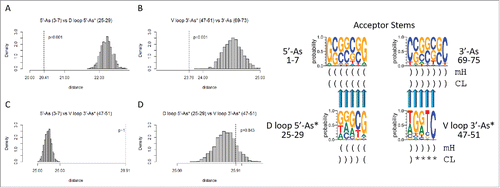
Table 1. Analyses of p-values for homology and complementarity tests indicate that the model for tRNA cloverleaf evolution is correct. The tests that most strongly support the model were highlighted in green. NC indicates that the test is against the complement (the non-coding DNA strand) of the sequence. For convenience, sequences are annotated (As: Acceptor stem; As*: Acceptor stem remnant; D: D loop; Ac: Anticodon loop; T: T loop). Note that, because sequences are not palindromic, a test of a sequence against its complement or against the complement of its homolog gives a high p-value (p >0.05).
Figure 6. The T loop and the Ac loop 17-nt microhelices are homologs, but the D loop microhelix is distinct in sequence. Symbols for sequence logos are the same as in . The U-turn is indicated by a red arrow.
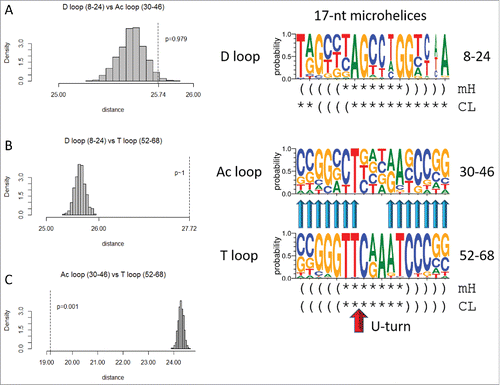
Figure 7. Complementary sequences in the tRNA cloverleaf support the model for tRNA evolution. J is a negative control test for I. Because these sequences are complementary but not homologous, the posited D loop minihelix stems test as homologs vs. their stem complement (I) but as non-homologs (stem vs. stem) in a direct sequence comparison (J).
Figure 8. Breaking the 17-nt D loop microhelix into TAGCC4 repeats. In the sequence logo, different modes of folding the D loop microhelix are indicated (TAGCCTAGCCTAGCCTA repeat folding; folding in a 17-nt microhelix or a 31-nt minihelix (mH); folding in the cloverleaf tRNA (CL)). Parentheses indicate base pairing. Asterisks indicate unpaired bases. Tests A–I are predicted to test as similar for a perfect repeat. Degeneracy in the third repeat (invariant A14 vs. invariant G19) causes the test in H to test as negative for similarity.
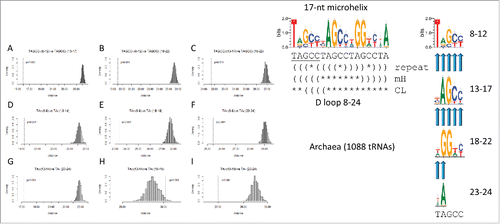
Table 2. Homology tests for the (UAGCC)4 D loop repeat. Yellow shading indicates a single break from the (UAGCC)4 repeat pattern due to invariant A14 vs. invariant G19.
Figure 9. Acceptor stems may be generated from a (GCG)3 repeat. Tests B–D are consistent with the (GCG)3 repeat model. Test A is a trivial test of the complementarity of the 5′ and 3′ acceptor stems. Tests E–H are negative control tests for the tests directly above.