
Figures & data
Figure 1. Comparisons of R1 and R2 elements and selective induction of R1 by heat shock. (A) Schematic representation of R1 and R2 retrotransposons shown inserted into the 28S region of Drosophila melanogaster ribosomal DNA. R2 has a single ORF whereas R1 has two ORFs. R1 is therefore structurally similar to the mammalian LINE-1 (L1) retrotransposon (box). Horizontal arrows and corresponding numbers indicate the positions of primers (F = Forward and R = Reverse) used for semi-quantitative RT-PCRs and qRT-PCRs. (B) Semi-quantitative RT-PCRs were performed with total RNA isolated from non-heat shocked (control) and heat shocked wild type third instar larvae. (C) qRT-PCR analyses performed with first-strand cDNAs from control and heat shocked larvae as in (B). Ct values for each gene were normalized to Actin 5C transcript levels. P values were determined using the Student’s t-test with degrees of freedom = 3.
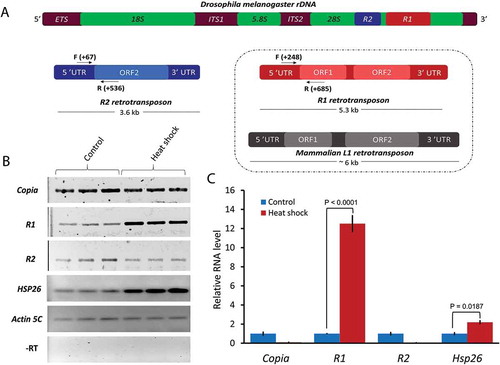
Figure 2. Oxidative stress and nucleolar stress fail to induce R1 expression. (A) Semi-quantitative RT-PCR analyses measuring respective transcripts in total RNA from control larvae versus larvae treated with 3% H2O2 (oxidative stress). (B) qRT-PCR analyses measuring respective transcripts in total RNA from control larvae and larvae treated with 3% H2O2. Ct values for each gene were normalized to Actin 5C transcript levels. P values were determined using the Student’s t-test with degrees of freedom = 3. (C) Semi-quantitative RT-PCRs measuring respective transcripts in total RNA from control wild type larvae, control P5CDh1-/- larvae (homozygous for a pBac element in the P5CDh1 gene) which control for nucleolar stress documented in homozygous Nopp140-/- gene knock out larvae [Citation9]. (D) qRT-PCR analyses measuring the copia, R1, and R2 transcript levels from wild type (WT), P5CDh1-/- larvae, and nucleolar stressed Nopp140-/- larvae. Ct values for each gene were normalized to Actin 5C transcript levels. P values were determined using the Student’s t-test with degrees of freedom = 3.
![Figure 2. Oxidative stress and nucleolar stress fail to induce R1 expression. (A) Semi-quantitative RT-PCR analyses measuring respective transcripts in total RNA from control larvae versus larvae treated with 3% H2O2 (oxidative stress). (B) qRT-PCR analyses measuring respective transcripts in total RNA from control larvae and larvae treated with 3% H2O2. Ct values for each gene were normalized to Actin 5C transcript levels. P values were determined using the Student’s t-test with degrees of freedom = 3. (C) Semi-quantitative RT-PCRs measuring respective transcripts in total RNA from control wild type larvae, control P5CDh1-/- larvae (homozygous for a pBac element in the P5CDh1 gene) which control for nucleolar stress documented in homozygous Nopp140-/- gene knock out larvae [Citation9]. (D) qRT-PCR analyses measuring the copia, R1, and R2 transcript levels from wild type (WT), P5CDh1-/- larvae, and nucleolar stressed Nopp140-/- larvae. Ct values for each gene were normalized to Actin 5C transcript levels. P values were determined using the Student’s t-test with degrees of freedom = 3.](/cms/asset/8b2e5b63-c431-473b-945b-6ab657d1de22/ktrn_a_1506682_f0002_oc.jpg)
Figure 3. Actinomycin D, but not alpha-amanitin, blocks R1 expression upon heat shock. (A) Semi-quantitative RT-PCR assays measuring respective transcript levels in total RNA isolated from untreated, Actinomycin D (0.08 µg/mL) treated, heat shocked, and actinomycin D + heat shock treated S2 cells. (B) qRT-PCR analyses performed with the first strand cDNAs from all of the treatments used in (A). Ct values for each gene were normalized to the expression of Actin 5C exonic transcript. P values were determined using the Student’s t-test with degrees of freedom = 2. (C) Semi-quantitative RT-PCR assays measuring R1, ITS2, and Actin 5C intron-exon junction transcripts in untreated, α-amanitin (15 µg/mL) treated, heat shocked, and α-amanitin + heat shock treated S2 cells. (D) Bar graph showing qRT-PCR analysis performed with the first strand cDNAs from all of the treatments used in (C). Ct values for each gene were normalized to ITS2 transcript levels. P values were determined using the Student’s t-test with degrees of freedom = 2.
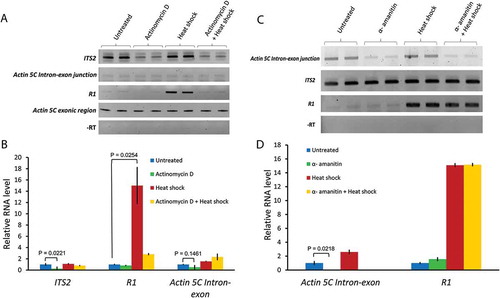
Figure 4. Read-through transcription from 28S into R1 elements upon heat shock. (A) Read-through transcription was shown by semi-quantitative RT-PCRs using two separate forward primers at positions −47 and −167 in upstream 28S sequences to amplify first strand cDNAs prepared using a reverse primer at position +685 within R1. (B) Sequence analysis of the RT-PCR products displayed in Figure 4(a) showed the 28S rDNA sequences β’ (green) and β” (purple) directly upstream of R1 elements [see [Citation27]]. The complete 5ʹ end of R1 is shown in red with two putative pause buttons in yellow and a heat shock element in blue. Consensus sequences for the pause button [Citation30] and the heat shock element [Citation31] are provided for comparison. R represents a purine (A or G), and W represents a weaker hydrogen-bonding base (A or T).
![Figure 4. Read-through transcription from 28S into R1 elements upon heat shock. (A) Read-through transcription was shown by semi-quantitative RT-PCRs using two separate forward primers at positions −47 and −167 in upstream 28S sequences to amplify first strand cDNAs prepared using a reverse primer at position +685 within R1. (B) Sequence analysis of the RT-PCR products displayed in Figure 4(a) showed the 28S rDNA sequences β’ (green) and β” (purple) directly upstream of R1 elements [see [Citation27]]. The complete 5ʹ end of R1 is shown in red with two putative pause buttons in yellow and a heat shock element in blue. Consensus sequences for the pause button [Citation30] and the heat shock element [Citation31] are provided for comparison. R represents a purine (A or G), and W represents a weaker hydrogen-bonding base (A or T).](/cms/asset/fd78e180-6e72-45bf-89e5-d81c6852ab52/ktrn_a_1506682_f0004_oc.jpg)
Figure 5. Precision run-on sequencing (PRO-seq) data [Citation30] analysis showing RNA Pol I within R1 elements upon heat shock. (A) Bar graphs showing Pol I density on the 28S region (left panel), on R1 elements (right panel), and on R2 elements (middle panel). Bar graphs were generated using UGENE software for control (no heat shock, NHS) and heat shocked (HS) S2 cells (see Materials and Methods). Graphs were scaled equally on their Y axes. (B) Upper panel: PRO-seq data analysis bar graphs showing RNA Pol I within R1 elements (5356 bp) under no heat shock (NHS) and heat shock (HS) conditions. Bar graphs were generated and scaled equally on their Y axes using IGV2 [Citation48]. Lower panel: magnified view of Pol I densities on the 5ʹ end of R1 elements under heat shock conditions. Dashed blue lines magnify the 5ʹ end of R1 elements where transcripts accumulate upon heat shock. This graph and the underlying DNA sequence were generated using Savant genome browser (Materials and Methods). A partially inverted motif (GACTCGTC) reminiscent of a HSF binding site is boxed. Nucleotide position +349 (T, arrow) marks an increased accumulation of R1 transcripts upon heat shock.
![Figure 5. Precision run-on sequencing (PRO-seq) data [Citation30] analysis showing RNA Pol I within R1 elements upon heat shock. (A) Bar graphs showing Pol I density on the 28S region (left panel), on R1 elements (right panel), and on R2 elements (middle panel). Bar graphs were generated using UGENE software for control (no heat shock, NHS) and heat shocked (HS) S2 cells (see Materials and Methods). Graphs were scaled equally on their Y axes. (B) Upper panel: PRO-seq data analysis bar graphs showing RNA Pol I within R1 elements (5356 bp) under no heat shock (NHS) and heat shock (HS) conditions. Bar graphs were generated and scaled equally on their Y axes using IGV2 [Citation48]. Lower panel: magnified view of Pol I densities on the 5ʹ end of R1 elements under heat shock conditions. Dashed blue lines magnify the 5ʹ end of R1 elements where transcripts accumulate upon heat shock. This graph and the underlying DNA sequence were generated using Savant genome browser (Materials and Methods). A partially inverted motif (GACTCGTC) reminiscent of a HSF binding site is boxed. Nucleotide position +349 (T, arrow) marks an increased accumulation of R1 transcripts upon heat shock.](/cms/asset/9e75c123-235f-4919-b877-dc3293e1afe9/ktrn_a_1506682_f0005_oc.jpg)
Figure 6. Proposed model showing a stalled RNA Pol I complex (black) near the “pause button” (yellow) within the 5ʹ end of R1 elements under non-heat shock conditions. Thin irregular lines attached to the Pol I complexes (green) represent pre-rRNA transcripts. Upon heat shock, pre-positioned and stalled Pol I complexes on R1 elements are released allowing them to read farther into R1 resulting in the accumulation of 28S-R1 cotranscripts with R1 transcript sequences represented as the thicker red line. Extended heat shock likely reduces the number of Pol I complexes on the 18S and 28S regions of the rDNA. The inverted repeat sequence (GACTCGTC) at +349 is shown in blue.
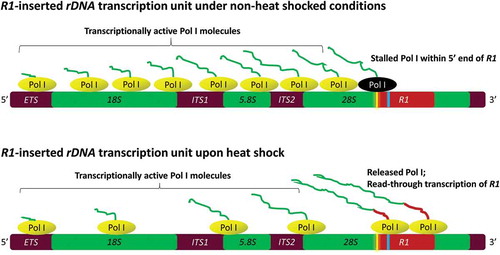
Table 1. Primers used for RT-PCRs/qRT-PCRs. Primers marked by (*) were used for both RT-PCRs and qRT-PCRs. The primers without (*) were used for semi-quantitative RT-PCR only. The R1 RT-Reverse primer was used for experiments in , and .