Figures & data
Figure 1. Acute reduction of Ser2 phosphorylation levels by H2O2 exposure. Western blots of whole-cell lysates prepared from cells treated as indicated. Blots were probed with the antibodies indicated on the right. (a) HeLa cells were subjected to the stress indicated on the top for the indicated time. (b) HeLa cells were incubated with 0.5 mM H2O2 for the indicated times. (c) HeLa cells were incubated with the indicated concentrations of H2O2 for 1 hour. (d) U87, MCF7, and DT40 cells were treated with the indicated concentrations of H2O2 for 1 hour.
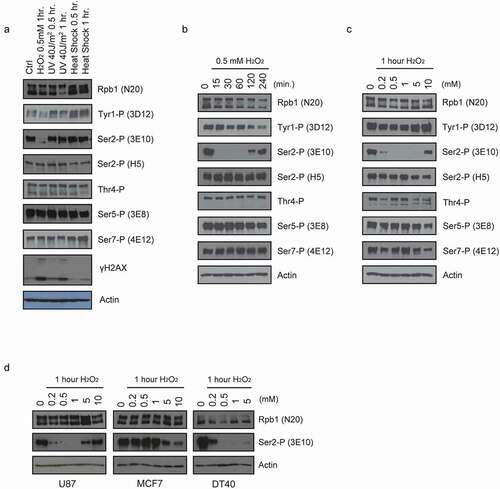
Figure 2. H2O2 and CDK9 inhibitors affect Ser2 phosphorylation and transcription/ 3’ processing differently. (a) Western blot of whole-cell lysates from Hela cells treated with 0.5 mM H2O2, 50 uM DRB (5,6-dichloro-1-b-D-ribofuranosylbenzimidazole) or 0.5 uM Flavopiridol for 1 hour. Blots were probed with the antibodies indicated on the right. (b, c) RT-qPCR. Diagrams at the top depict analyzed genes. Positions and strand directions of primers used in RT-qPCR to detect nascent, spliced and uncleaved RNAs are indicated by arrowheads. The graphs display the RT-qPCR data from RNA isolated from HeLa cells treated as in (A) with the compound indicated on the right, normalized to corresponding data from control cells. Values shown are the mean ± s.d. of n = 3 independent replicates.
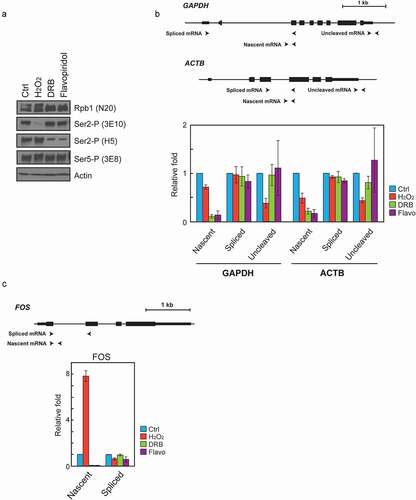
Figure 3. H2O2 decreases Ser2-P levels and Pol II and PA factor occupancy at the gene 3’ end. (a) Schematic illustration of the human GAPDH gene. Positions of amplicons are indicated. (b-e) ChIP assays for Ser2-P, Rpb1, Tyr1-P and CSTF77, respectively. HeLa cells were either untreated (Ctrl) or treated with 0.5 mM H2O2 for 1 hour prior to addition of formaldehyde and preparation of cell lysates. Results are presented as the percent of input signal. Values shown are the mean ± s.e. [n = 5 for Rpb1; n = 3 for Ser2-P, Tyr1-P and CSTF77]. The P value was determined by two-tailed Student’s t-test. (**p < 0.01, *p < 0.05).
![Figure 3. H2O2 decreases Ser2-P levels and Pol II and PA factor occupancy at the gene 3’ end. (a) Schematic illustration of the human GAPDH gene. Positions of amplicons are indicated. (b-e) ChIP assays for Ser2-P, Rpb1, Tyr1-P and CSTF77, respectively. HeLa cells were either untreated (Ctrl) or treated with 0.5 mM H2O2 for 1 hour prior to addition of formaldehyde and preparation of cell lysates. Results are presented as the percent of input signal. Values shown are the mean ± s.e. [n = 5 for Rpb1; n = 3 for Ser2-P, Tyr1-P and CSTF77]. The P value was determined by two-tailed Student’s t-test. (**p < 0.01, *p < 0.05).](/cms/asset/8406c087-cfa8-44a2-985c-a405678c8c16/ktrn_a_2009421_f0003_oc.jpg)
Figure 4. H2O2 inhibits U1, U4 and U5 but not U2 snRNA 3’ cleavage. Top, schematic illustrations describing the gene structure of the human snRNA genes. Arrowheads denote the positions of the primers used to amplify total and uncleaved RNA. Vertical arrows indicate the site of 3’ cleavage. Bottom. HeLa cells were treated with the compounds indicated on the right as in . Total RNA was isolated, and expression levels of total and uncleaved U1, U2, U4, and U5 snRNAs were analyzed by RT-qPCR. Expression of 7SK RNA was used as an internal control. The RT-qPCR data from treated cells were normalized to those of the corresponding control cells, and are represented as the mean ± s.d. of n = 3 replicates.
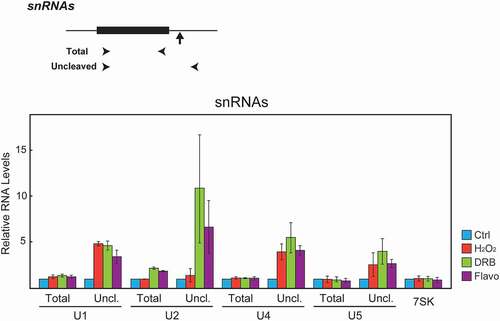
Figure 5. CK2, but not FCP1, is involved in H2O2-induced Ser2-P inhibition. (a) Effects of CK2 inhibition on H2O2-induced Ser2-P loss were measured by Western blot. Hela cells were pre-treated with the indicated concentrations of TBB or CX-4945 for 15 min, then treated with 0.5 mM H2O2 for 1 hour. Blots were probed with antibodies indicated on the right. (b) Effect of FCP1 knockdown on H2O2-induced Ser2-P reduction. HeLa cells were transfected with control siRNA and siRNA targeting FCP1 as indicated and cultured for 36 hours. 0.5 mM H2O2 was then added for the times shown, whole-cell lysates prepared and analyzed by Western blot. Antibodies used are indicated on the right.
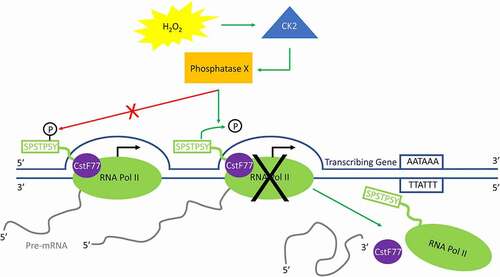
Figure 6. Model for H2O2-induced premature transcription termination. In response to H2O2-induced oxidative stress, CK2 activates an unidentified phosphatase (phosphatase X) that dephosphorylates Ser2-P only when RNA Pol II is near the 3ʹ end of a transcribing gene. This triggers the release of PA factors such as CstF77 from the elongation complex, as well as RNA Pol II itself, and transcription is prematurely terminated.