Figures & data
Figure 1. FACT domains and structure. (a) Domain organization of human FACT subunits. The gray double arrows indicate known physical interactions of FACT domains with histones. NTD, N-terminal domain; DD, dimerization domain; MD, middle domain; CTD, C-terminal domain; IDD, intrinsically disordered domain; HMG, High mobility group domain; PH, Pleckstrin homology. (b) Structure of human FACT bound to a nucleosome (PDB ID: 6UPL) [Citation50]. The structure of the SPT16-NTD (PDB ID: 5E5B) [Citation55] and SSRP1-HMG (PDB ID: 6L34) [Citation56] were added (boxed structures) to contextualize their relative size. (c) A view of the FACT-nucleosome structure (PDB ID: 6UPL; containing 79 bp of DNA, dark gray) that also displays the DNA of a fully-wrapped (146 bp) nucleosome from PDB ID: 2CV5 (old pink) [Citation210]. Notice the clash between the path of the DNA and the Spt16-MD, as well as the position of the SPT16-CTD, mimicking the path of the DNA in the full nucleosome. Molecular graphics and analyses were performed with UCSF ChimeraX [Citation211]. The docking in panel C was done on the histone proteins from PDB ID: 6UPL and PDB ID: 2CV5 using the MatchMaker tool in ChimeraX. The histones from PDB ID: 2CV5 were hidden.
![Figure 1. FACT domains and structure. (a) Domain organization of human FACT subunits. The gray double arrows indicate known physical interactions of FACT domains with histones. NTD, N-terminal domain; DD, dimerization domain; MD, middle domain; CTD, C-terminal domain; IDD, intrinsically disordered domain; HMG, High mobility group domain; PH, Pleckstrin homology. (b) Structure of human FACT bound to a nucleosome (PDB ID: 6UPL) [Citation50]. The structure of the SPT16-NTD (PDB ID: 5E5B) [Citation55] and SSRP1-HMG (PDB ID: 6L34) [Citation56] were added (boxed structures) to contextualize their relative size. (c) A view of the FACT-nucleosome structure (PDB ID: 6UPL; containing 79 bp of DNA, dark gray) that also displays the DNA of a fully-wrapped (146 bp) nucleosome from PDB ID: 2CV5 (old pink) [Citation210]. Notice the clash between the path of the DNA and the Spt16-MD, as well as the position of the SPT16-CTD, mimicking the path of the DNA in the full nucleosome. Molecular graphics and analyses were performed with UCSF ChimeraX [Citation211]. The docking in panel C was done on the histone proteins from PDB ID: 6UPL and PDB ID: 2CV5 using the MatchMaker tool in ChimeraX. The histones from PDB ID: 2CV5 were hidden.](/cms/asset/72f36d2f-d71e-492e-8cdc-32bc754b1406/ktrn_a_2069995_f0001_oc.jpg)
Figure 2. A model of the RNAPII elongation complex engaging a nucleosome bound by FACT. The structure of the human RNAPII elongation complex (RNAPII, PAF1C, DSIF, SPT6; PDB ID: 6TED) [Citation60] was docked on the structure of yeast FACT bound to a nucleosome engaged by RNAPII-Spt4/5 (PDB ID: 7NKY) [Citation59]. The RNA, RNAPII, and DSIF are from PDB ID: 6TED (the ones from PDB ID: 7NKY are hidden). The docking was done on the RNAPII molecules using the MatchMaker tool in ChimeraX [Citation211].
![Figure 2. A model of the RNAPII elongation complex engaging a nucleosome bound by FACT. The structure of the human RNAPII elongation complex (RNAPII, PAF1C, DSIF, SPT6; PDB ID: 6TED) [Citation60] was docked on the structure of yeast FACT bound to a nucleosome engaged by RNAPII-Spt4/5 (PDB ID: 7NKY) [Citation59]. The RNA, RNAPII, and DSIF are from PDB ID: 6TED (the ones from PDB ID: 7NKY are hidden). The docking was done on the RNAPII molecules using the MatchMaker tool in ChimeraX [Citation211].](/cms/asset/86a509ff-827a-4ba8-bfb4-7c5455cde5c1/ktrn_a_2069995_f0002_oc.jpg)
Figure 3. A proposed model of the dynamic interactions between FACT and a nucleosome transcribed by RNAPII. The nucleosome is represented linearly for simplification and the regions contacted by the various histones along the DNA are represented as white rectangles. Superhelical locations (SHL −7 to +7) and the dyad axis are indicated. Yeast FACT is represented with the same color code as human FACT in and proposed dynamic interactions with histones and DNA are depicted at key steps of RNAPII transcribing through the nucleosome. This model is based on available biochemical, structural, and genomic data cited in the main text but remains highly speculative. Note that the Pob3-CTD and Spt16-NTD are depicted in step 2 despite not being visible in the structure from Farnung et al. [Citation59].
![Figure 3. A proposed model of the dynamic interactions between FACT and a nucleosome transcribed by RNAPII. The nucleosome is represented linearly for simplification and the regions contacted by the various histones along the DNA are represented as white rectangles. Superhelical locations (SHL −7 to +7) and the dyad axis are indicated. Yeast FACT is represented with the same color code as human FACT in Figure 1a and proposed dynamic interactions with histones and DNA are depicted at key steps of RNAPII transcribing through the nucleosome. This model is based on available biochemical, structural, and genomic data cited in the main text but remains highly speculative. Note that the Pob3-CTD and Spt16-NTD are depicted in step 2 despite not being visible in the structure from Farnung et al. [Citation59].](/cms/asset/a141b0b3-228f-4179-b215-14a7724377d0/ktrn_a_2069995_f0003_oc.jpg)
Figure 4. Roles of FACT during transcription elongation (chromatin safe keeper model). A nucleosome array is represented before (top), during (middle) and after (bottom) the passage of RNAPII, in WT cells (left) and in cells where FACT function is impaired (right). The distribution of some histones modifications (colored rectangles, ovals, triangles, and hexagons) and H2A.Z histone variant (z) are shown.
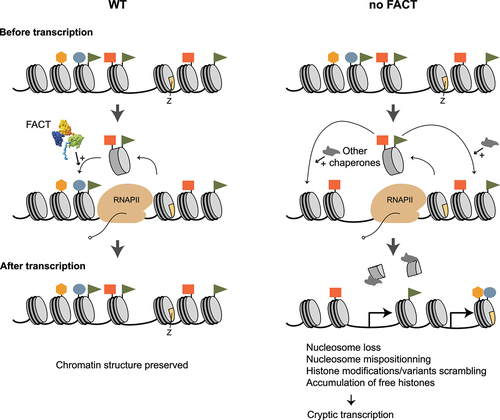
Figure 5. Role of FACT during transcription initiation at specific genes in mammalian cells. (a-d) Four different previously described roles played by FACT at specific promoters or enhancers are depicted (see main text for details). Physical interactions are represented as double arrows. Stabilizing (arrows with “+” signs) and destabilizing (inhibitory arcs) effects on nucleosomes are depicted.
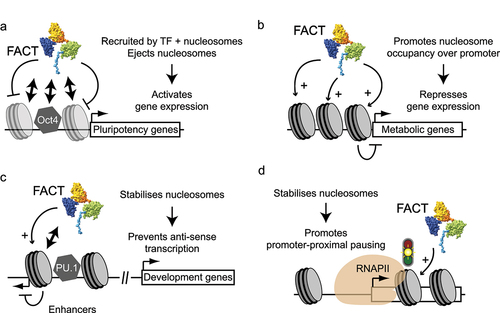
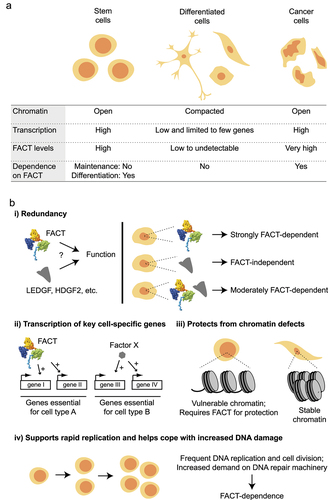
Figure 6. Different aspects of FACT in mammalian cells. (a) A summary of key characteristics of stem, differentiated, and cancer cells. (b) Previously proposed mechanisms that may explain why FACT is only essential in some cell types. See main text for details.