
Figures & data
Table 1. Percentages of patients with specific complication events, by surgical subgroup.
Figure 1. Estimated net cost impact of using Floseal versus Surgiflo in an average US hospital performing 245 cardiac surgical procedures per year.
Source: Own elaboration with data obtained from Makhija D, Rock M, Xiong Y, et al. Cost-consequence analysis of different active flowable hemostatic matrices in cardiac surgical procedures, Journal of Medical Economics. 2017;20(6):565–573, DOI: 10.1080/13,696,998.2017.1284079 homepage: http://www.tandfonline.com/loi/ijme20.
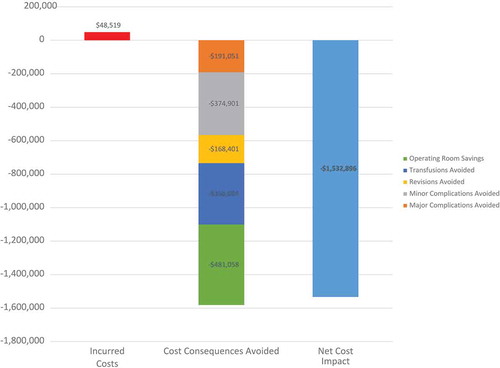
Table 2. Group assignment by primary or secondary ICD-9 procedural codes.
Table 3. Patient and provider characteristics after propensity score matching.
Table 4. Results of clinical outcomes on propensity matched pairs (Floseal only vs. Floseal + gelatin/thrombin).
Table 5. Results of healthcare resource utilization outcomes on propensity matched pairs (Floseal only vs. Floseal + gelatin/thrombin).