
Figures & data
Table 1. Means and standard deviations of assumed knowledge ratings, split up by experimental group as well as by pre-rating and post-rating.
Figure 1. Participants’ mean values for assumed knowledge ratings, split by experimental group as well as by pre-rating and post-rating.
Note. Error bars represent standard errors.
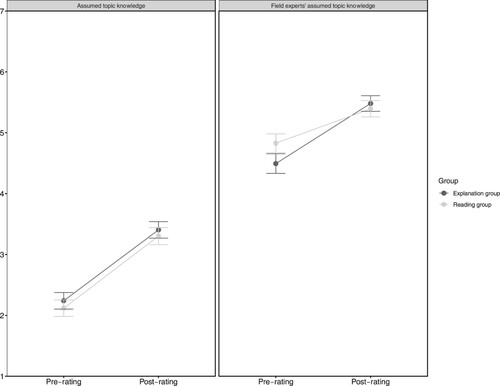
Figure 2. Mean values for assumed scientific method knowledge ratings, split by experimental group as well as by pre-rating and post-rating.
Note. Error bars represent standard errors.
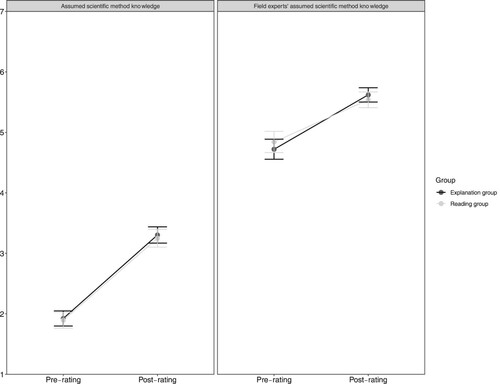
Table 2. Descriptive statistics for reported strategies and intellectual humility by experimental group.
Table 3. Correlations between assumed (scientific method) knowledge, strategies for coping with the division of cognitive labour and intellectual humility.
Supplemental Material
Download Zip (222.7 KB)Data availability statement
The datasets generated and analysed during the current study are available in the ZPID repository (https://www.psycharchives.org/handle/20.500.12034/2778).