
Figures & data
Table 1. Main activities in the online Science Bazaar 2021 and how they were adapted from physical to live Science Bazaar.
Figure 1. Box plots embedded in violin plots showing the predicted number of unique viewers per resource used, divided by resource type, in the online Science Bazaar 2021. Predictions are based on a generalised linear mixed model.
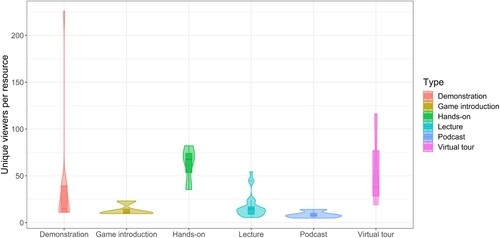
Table 2. Pairwise comparisons following a generalised linear mixed model to estimate the influence of the activity type on the number of unique viewers who accessed the resources used in the online Science Bazaar 2021.
Table 3. Comparison between physical and online Science Bazaars.
Data availability statement
The data that support the findings of this study are available from the corresponding author, KAIN, upon reasonable request.