Figures & data
Figure 1. Morphology of little tuna (Euthynnus affinis).
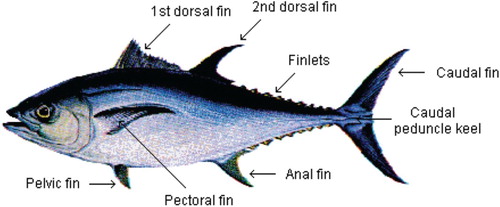
Figure 2. Global trends in little tuna (Euthynnus affinis) capture production.
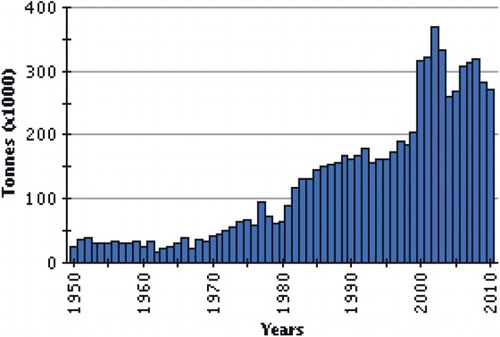
Figure 3. Map showing the Pakistan coastline.
Figure 4. Sea level trends along the Karachi coast, Pakistan.
Figure 5. Map of Karachi coast. Source: © Google Map Data 2014. Downloaded 20 October 2014.
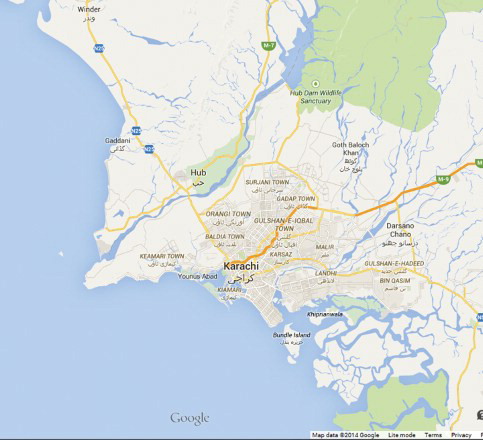
Figure 6. Little tuna (Euthynnus affinis) samples collected from Karachi coast.
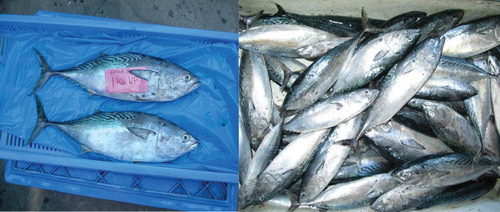
Figure 7. Data reduction process for fish tissue.
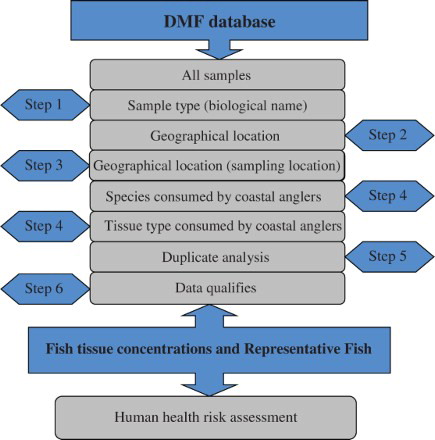
Figure 8. Contribution (%) of different gears to total E. affinis catch.
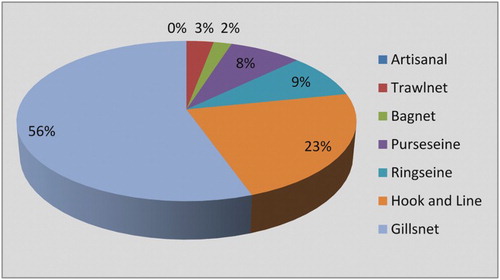
Figure 9. Annual landings of E. affinis during 2006–2013.
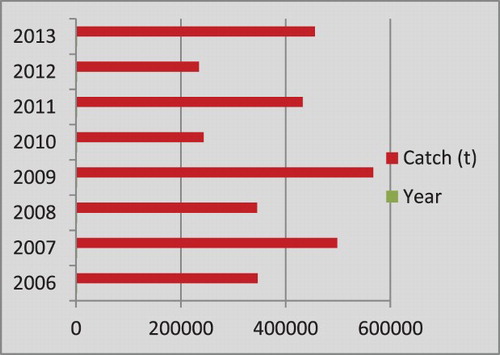
Figure 10. Seasonal trends in landing of E. affinis.
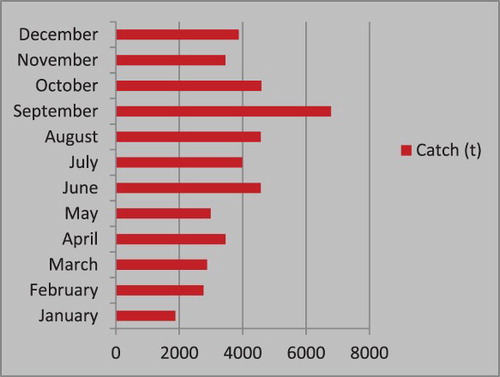
Figure 11. Length–frequency distribution of E. affinis in the fishery.
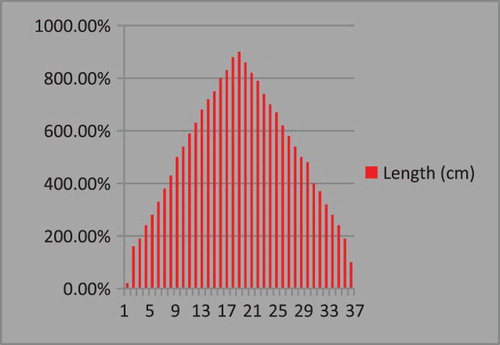
Table 1 Length and weight and seasonal distribution of Euthynnus affinis samples (X, SD = deviation, N = number of samples).
Table 2 Bonferroni test fish Euthynnus affinis collected from Karachi coast.
Figure 12. Observed and estimated size at first maturity for E. affinis.
Figure 13. Recruitment pattern in E. affinis.
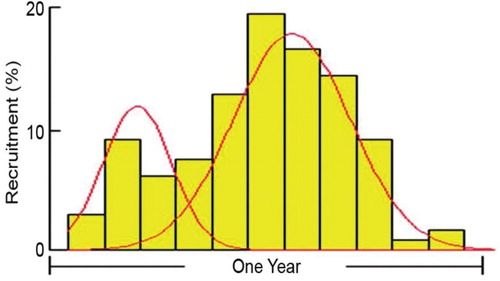
Figure 14. Feeding intensity (stomach condition) of E. affinis.
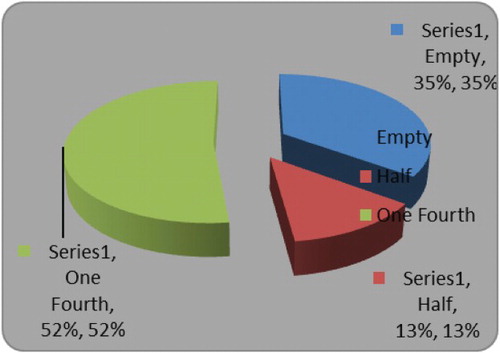
Figure 15. Major food groups constituting the diet of E. affinis.
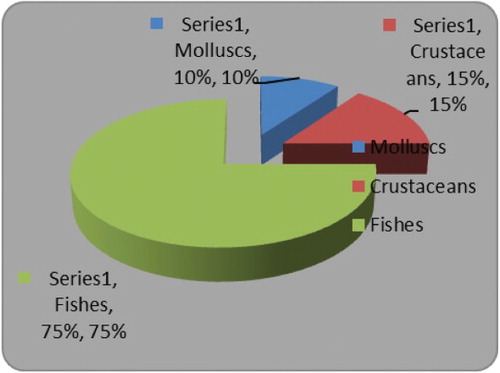
Figure 16. Mortalities and exploitation rate of E. affinis estimated using length converted catch curve.
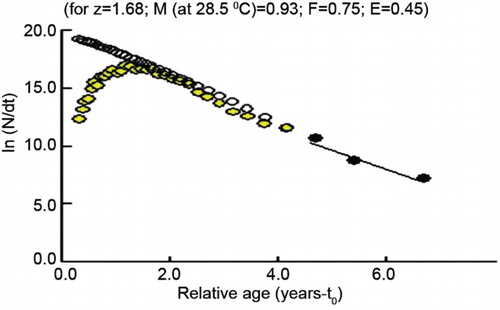
Figure 17. Virtual population analysis of E. affinis.
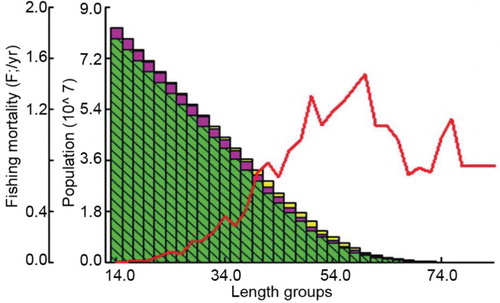
Figure 18. Yield per recruit and biomass per recruit curves for E. affinis.