Figures & data
Table 1. Parameters and their levels with significance levels.
Table 2. Experimental range and levels of the independent variables.
Table 3. Central composite design of factors in coded value for γ-aminobutyric acid (GABA) yield (mg/gds).
Figure 1. Flow diagram of the developed Simulink model for the feedforward back-propagation artificial neural network.
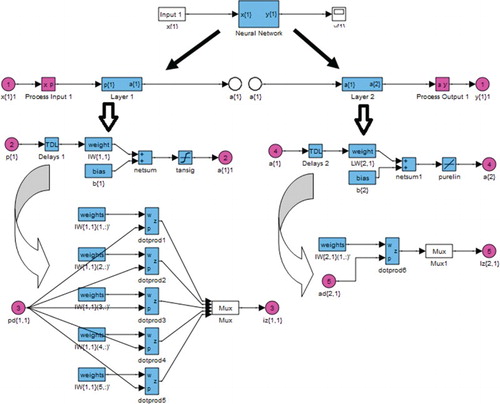
Figure 2. Chromatogram of mass spectra (m/z) for confirmation of γ-aminobutyric acid (GABA).
Figure 3. Proposed reaction of γ-aminobutyric acid (GABA) utilizing the ninhydrin protocol: (1) ninhydrin; (2) ninhydrin hydrate; (3) 1,2,3-indantrione; (4) ketimine; (5) 2-amino-1,3-indandione; (6) chromophore (Ruhemann's purple).
Figure 4. Three-dimensional response surface plot and contour plot showing the relative effect of pH and monosodium glutamate (MSG) on γ-aminobutyric acid (GABA) yield (mg/gds) while keeping incubation period at its central level.
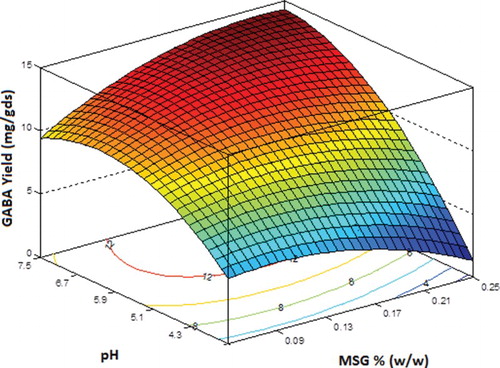
Figure 5. Three-dimensional response surface plot and contour plot showing the effect of monosodium glutamate (MSG) and incubation period on γ-aminobutyric acid (GABA) yield (mg/gds) while keeping pH at its central level.
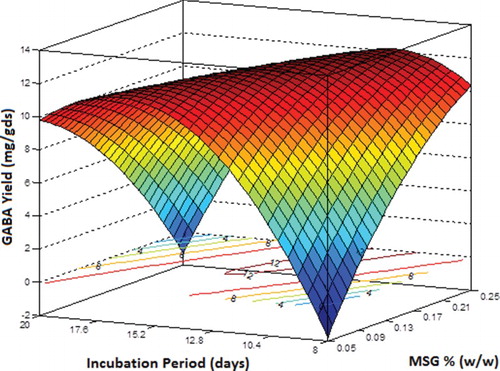
Figure 6. Three-dimensional response surface plot and contour plot showing the effect of pH and incubation period on γ-aminobutyric acid (GABA) yield (mg/gds) while keeping monosodium glutamate (MSG) concentration at its central level.
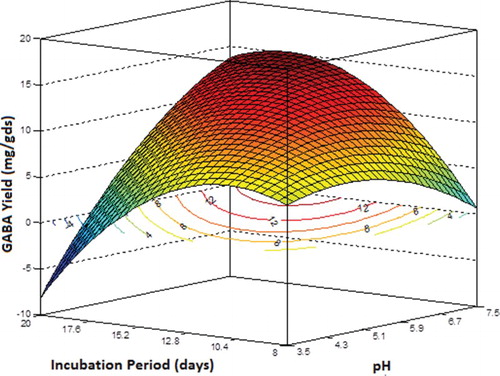
Table 4. Regression coefficient results from the data of central composite design experiments for γ-aminobutyric acid (GABA) yield.
Table 5. Analysis of variance (ANOVA) for response surface quadratic model for γ-aminobutyric acid (GABA) yield.
Figure 7. Linear fit for the results from the artificial neural network model.
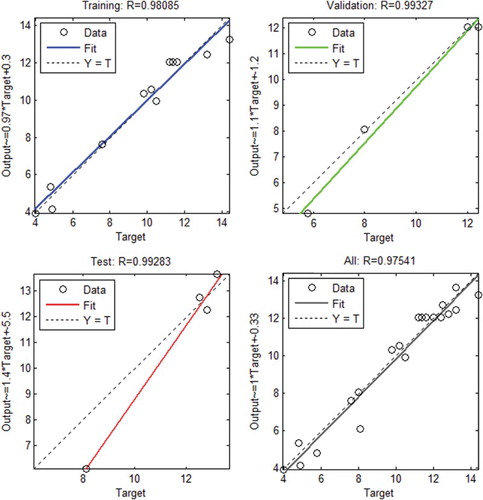
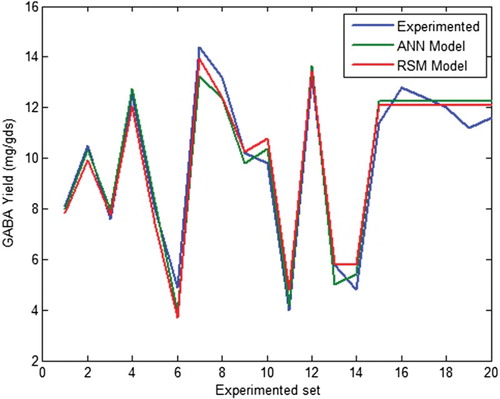
Figure 8. Comparison of γ-aminobutyric acid (GABA) yield obtained from the response surface methodology (RSM) and artificial neural network (ANN) models.