
Figures & data
Table 1. Details of samples and their categorization based on condition, under fertility trait, general health trait and milk production based on filed records.
Table 2. Number of reads obtained after quality filtering and mapping under different trait groups.
Table 3. Number of single nucleotide polymorphisms (SNPs) detected in different samples of various groups.
Figure 1. Distribution of annotated single nucleotide polymorphisms (SNPs). The highest number of SNPs was detected in the intergenic region, followed by the intron; the secondary pie chart shows the distribution of 393 SNPs detected in the exons of the genes.
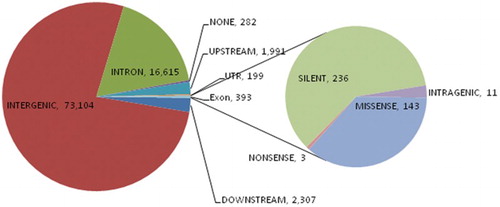
Figure 2. Distribution of single nucleotide polymorphisms (SNPs) annotated in various genic regions of the 23 individuals under study: colour formatting indicates high and low values. Lower numbers are presented in dark green to light green colours, whereas yellow to red colours indicate higher numbers of SNPs.
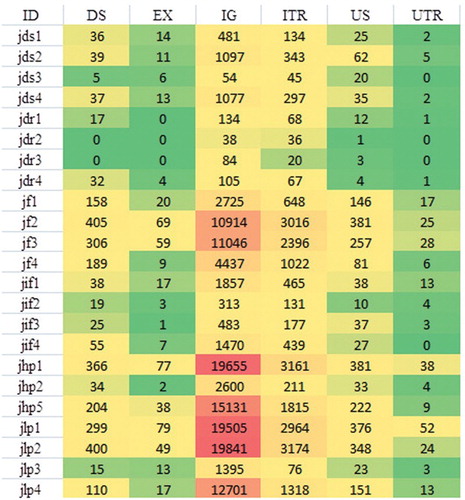
Table 4. List of gene ontology (GO) categories with their false discovery rate (FDR) values enriched in fertility and infertility trait samples.
Table 5. List of top gene ontology (GO) categories with their false discovery rate (FDR) values enriched in high milk production trait samples.
Table 6. List of gene ontology (GO) categories with their false discovery rate (FDR) values enriched in low milk production trait samples.
Supplemental material