Figures & data
Figure 1. Structural formula of citric acid, characterized by three –COOH groups.
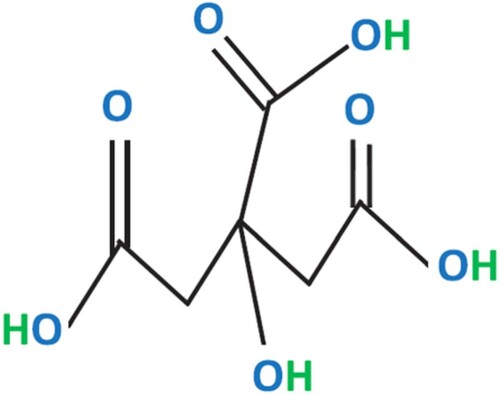
Figure 2. Schematic representation of the main metabolic reactions involved in the production of citric acid by Aspergillus niger (Soccol et al. Citation2006).
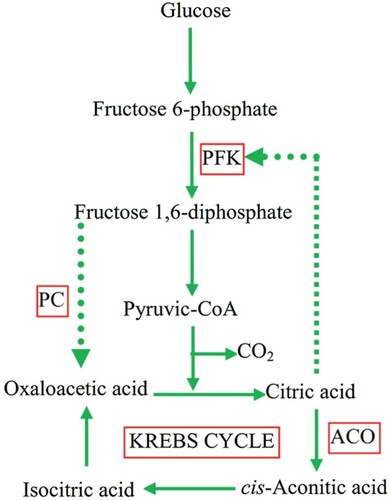
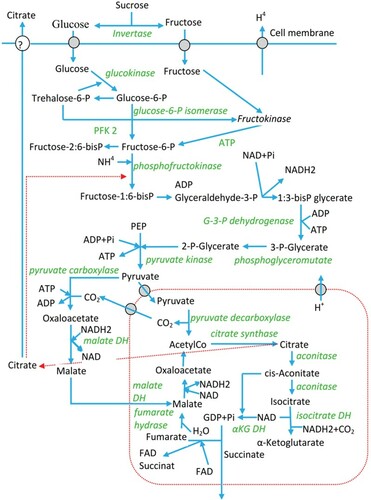
Figure 3. Schematic representation of the metabolic reactions involved in citric acid production, the enzymes (italics), the known feedback loops (dashed lines) and their locations within the cellular structure of Aspergillus niger (Papagianni Citation2007).