Figures & data
Figure 1. Graph of percentage inhibition of diameter growth (PIDG) values versus concentration of eugenol on Candida albicans. All data are the means obtained from three sets of triplicate tests (n = 9).
Figure 2. Graph of growth curve presented as log10 CFU/ml versus incubation time for Candida albicans treated with different concentrations of eugenol. Data are the mean ± SD of three determinations performed in triplicate (n = 9). AmB = amphotericin B.
Table 1. Cellular material contents released at 260 nm after 2 h incubation with different eugenol concentrations.
Figure 3. Graph of cell lysis of Candida albicans treated with different concentrations of eugenol. Data are the mean ± SD of three determinations performed in triplicate (n = 9). LT50 = median lethal time.
Table 2. Median lethal time (LT50) following treatment with various concentrations of eugenol.
Figure 4. Percentage of crystal violet uptake of Candida albicans. Data are the mean ± SD of three determinations performed in triplicate (n = 9). AmB = amphotericin B.
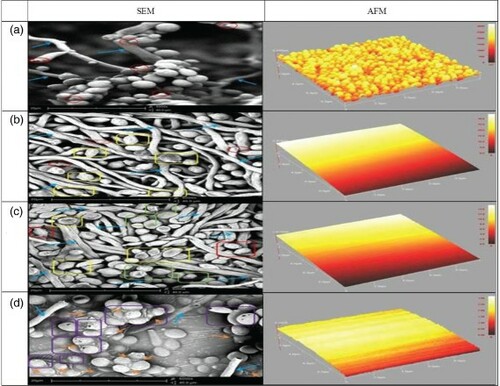
Figure 5. Scanning electron microscopy (SEM) at 6000 × magnification and atomic force microscopy (AFM) observations of (a) untreated Candida albicans, (b) C. albicans treated with 0.5% eugenol, (c) C. albicans treated with 1.0% eugenol, and (d) C. albicans treated with 2.0% eugenol. Buds and bud scars are indicated by (![]()