Figures & data
Table 1. Shotgun sequencing data summary for M50GL and M100GL.
Figure 1. Rarefaction curve for M50GL and M100GL groups by MEGAN. x-Axis = percentage of reads; y-axis = number of leaves in taxonomy.
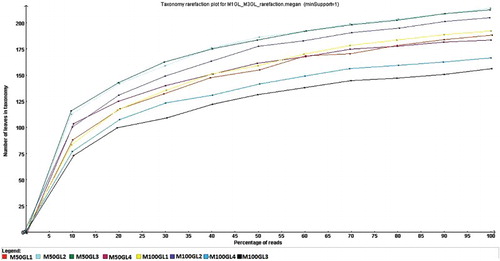
Figure 2. Heatmap showing the taxonomic classification of the M50GL and M100GL groups.
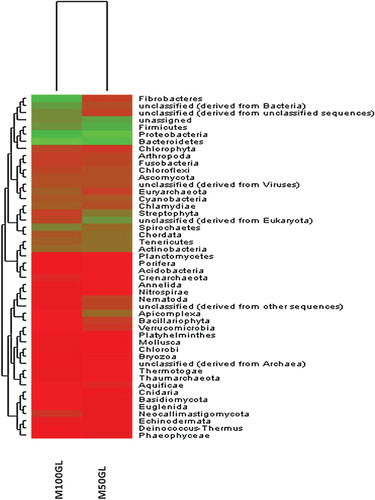
Figure 3. Extended error bar chart showing comparative abundance between M50GL and M100GL for different groups of Proteobacteria.
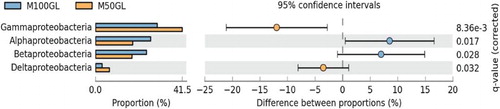
Figure 4. Tree showing species-level classification of phylum Euryarcheota for the M50GL and M100GL groups.
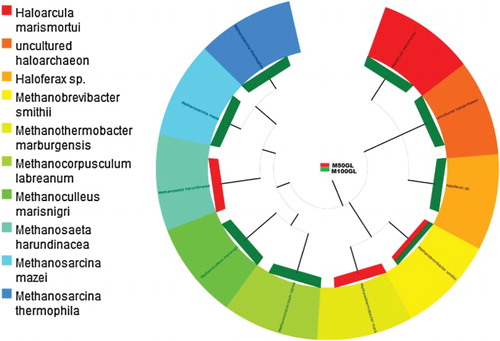
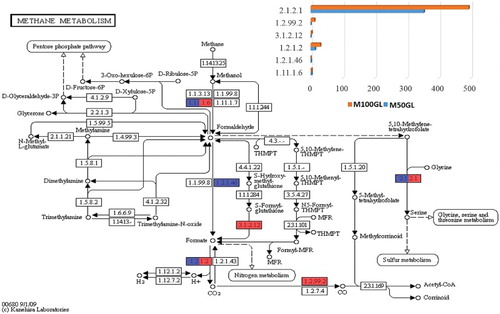
Figure 5. KEGG analysis showing enzymes involved in the methane metabolism pathway. The bar chart represents the abundance of enzymes for both M50GL and M100GL groups, where blue represents the M50GL group and red represents the M100GL group. x-Axis = abundance of enzymes; y-axis = E.C. number of enzymes involved in methane metabolism.