Figures & data
Figure 1. Effect of treatments with P. chlamydosporia on the densities of M. incognita in soil (a) and percent of damaged tubers at harvest (b).
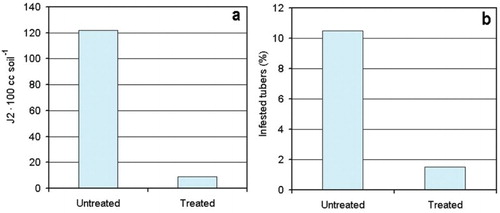
Figure 2. Relative humidity (a) and mean, maximum and minimum temperatures (b) registered at the station closest to the Ferrara field trial (March–August 2014).
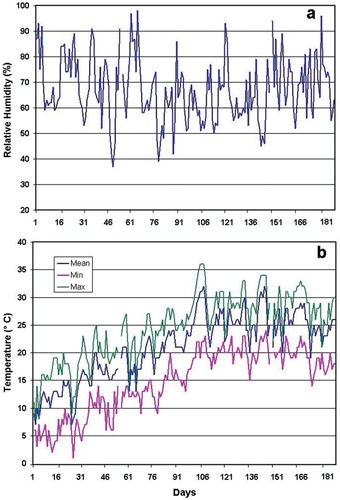
Figure 3. Relative humidity (a) and mean, maximum and minimum temperatures (b) registered at the station closest to the Fasano field trial (March–June 2013).
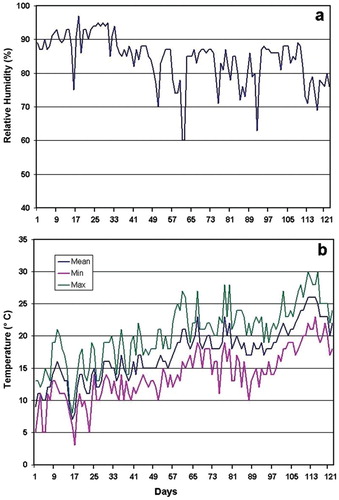
Figure 4. Effect of treatments with P. chlamydosporia on tomato plants after transplant. For treatments description see text. Vertical bars = SE.
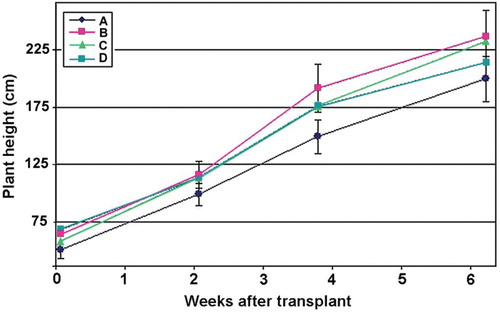
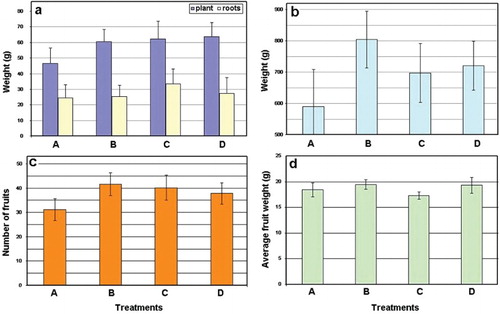
Figure 5. Effect of P. chlamydosporia on the tomato dry plant and root weights (a), fruit weight (b), number of fruits (c) and average fruit weight (d) at harvest. For treatments description see text. Vertical bars = SE.