Figures & data
Table 1. Antioxidant activity of different tea extracts against DPPH and ABTS radicals.
Table 2. Total phenolic compounds and flavonoids content (g/100g) in different tea extracts.
Figure 1. The dose–response curve of promising sample (green and black tea) compared with standard compound (BHA).
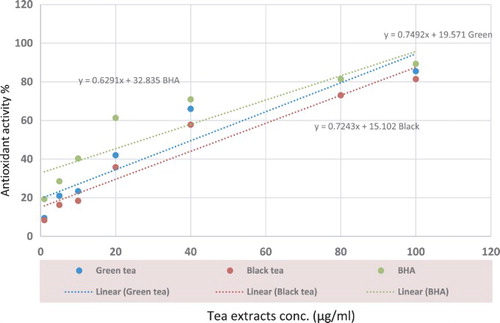
Figure 2. HPLC chromatogram obtained by the separation of green tea with aspartame extract.
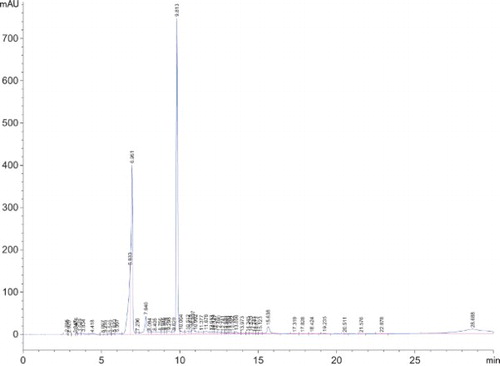
Table 3. Phenolic compounds and caffeine content (µg/100g) in different tea extracts.
Figure 3. FTIR of tea extracts where, 1. green tea only, 2. green tea with sucrose, and 3. black tea only, 4. black tea with sucrose, 5. green tea with aspartame, and 6. black tea with aspartame.
Table 4. FTIR data of different tea extracts.
Figure 4. The suggested reaction between sugar and phenols in green tea.
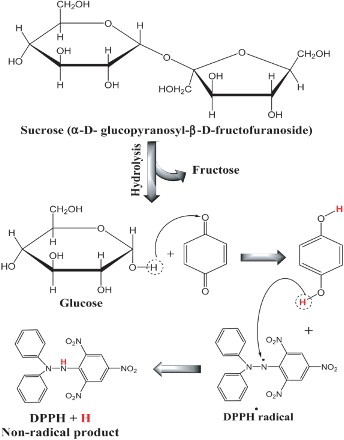
Figure 5. The suggested reaction between sugar and oxidized phenols (quinones) in black tea and possibility for scavenging of DPPH radical.