Figures & data
Figure 1. The well-known Mendeleev table corresponds to the matter of chemists. All chemical elements are included in this table, from hydrogen to heavy elements such as uranium. Heavier elements that are also shown have been synthesized in the laboratory. A box defines an element, it is characterized by the number of protons in the nucleus of the atom, Z. (Copyright, Ministère de la Recherche, France).
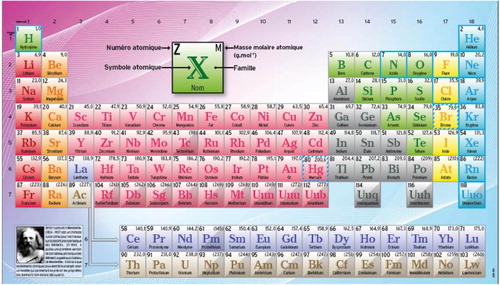
Figure 2. Astrophysical matter in the Universe. The abundances (normalized to hydrogen) are displayed with respect to the atomic number Z (number of protons).There are three astrophysical sites for nucleosynthesis (arrows);hydrogen and helium from big bang, carbon to uranium from stars and lithium, beryllium and boron from collisional processes between cosmic rays and interstellar matter, so-called spallative nucleosynthesis. Uranium is the least abundant element in the solar system.
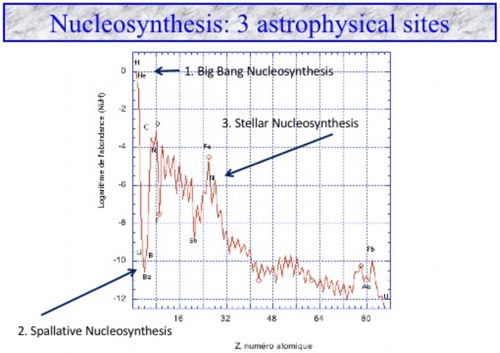
Figure 3. The law of Hubble is the first pillar of the big bang theory. It corresponds to the fact that relative velocities between galaxies are proportional to their distance. This is interpreted as a direct observation of the expansion of the Universe.
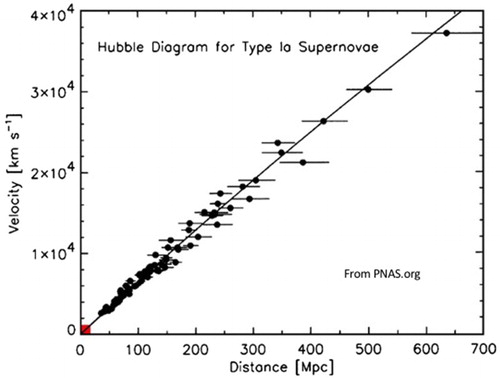
Figure 4. This is the CMB pillar of the big bang theory. Data points come from the COBE satellite.The black body curve predicted by the big bang theory (curve) and that observed in the CMB (points) are perfectly superposable.
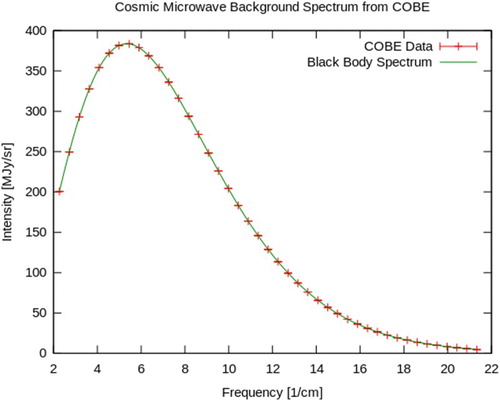
Figure 5. Content of the Universe. Critical density () of the Universe corresponds to the value predicted by the theory of inflation. Atoms represent only 4.9% of the Universe content. Among them the visible atoms (gas and galaxies) are even more rare (0.003). Most of baryons (hydrogen and helium) stay in the intergalactic medium. Fossil photons (CMB) represent a tiny fraction of the energy density of the Universe though being abundant.
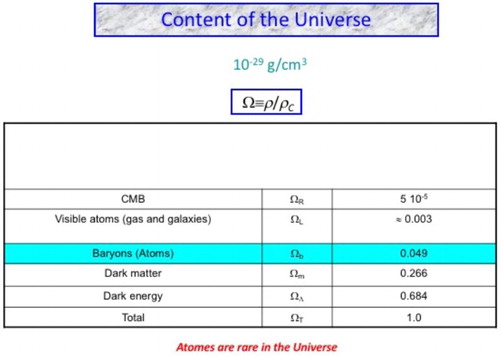
Figure 6. Cosmic timeline. Evolution of cosmic structure from the big bang up to now. After the dark ages, the first stars appeared about 400 millions years after the big bang and then galaxies started to develop. Recent observations suggest that the expansion of the Universe is accelerating due to dark energy. (Credit: NASA/WMAP Science Team).
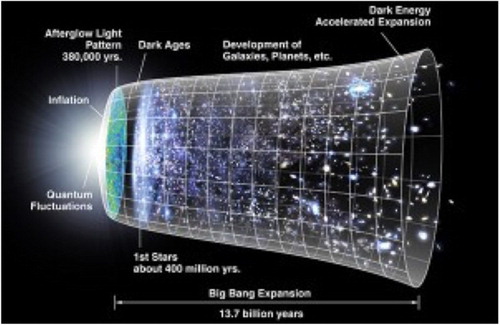
Figure 7. Network of nuclear reactions involved in BBN. There are 12 nuclear reactions responsible for the production of hydrogen, helium and lithium.
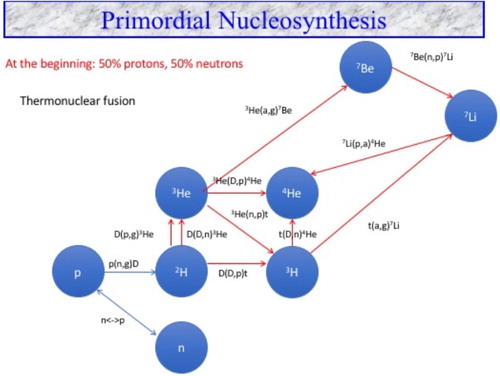
Figure 8. Evolution of the mass fraction of light isotopes ( hydrogen, deuterium, helium and lithium as a function of time (in seconds). The synthesis of these isotopes stops at about seconds. Lithium is extremely rare, 1 for 10 billions compared to hydrogen, (from Coc et al. Citation2015).
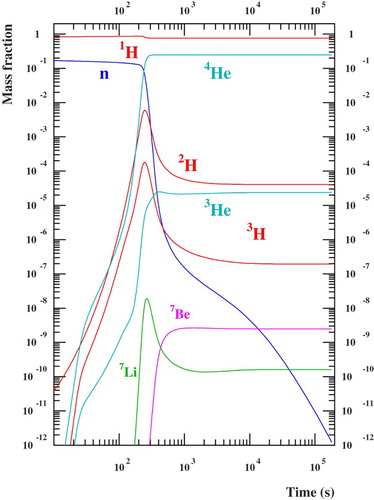
Figure 9. Abundances of the cosmological elements as a function of the ratio baryons/photons, η, for three neutrino families. The vertical areas correspond (i) to the CMB baryonic density observations coming from satellites WMAP (dot) and Planck (solid). The horizontal areas (hatched and dotted lines) represent the different adopted observational abundances. The dash-dotted lines correspond to He calculated with a different value of the number of neutrino families derived from the Planck mission (from Coc et al. Citation2014).
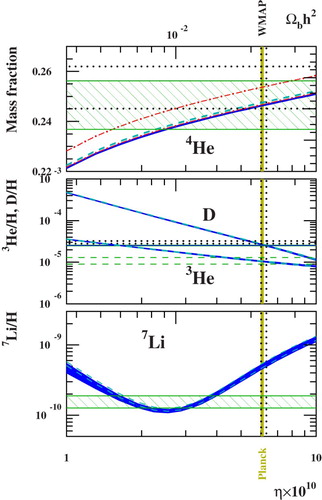
Figure 10. Li/H of old stars in the galactic halo as a function of [Fe/H] (bottom scale, which is referred to the solar abundance, 0 corresponds to the solar value, corresponds to 1/1000 of the solar value etc., astrophysical conventions :
of the star – log(Fe/H) of sun). The time scale is also shown, note that these stars are very old (about 12–13 Gyrs old). Primitive lithium abundance is deduced from observations of low metallicity stars (black points) in the halo of our Galaxy. There is a discrepancy (about a factor 3 to 5) between the value deduced from these observed spectroscopic abundances and the one calculated (horizontal line).
![Figure 10. Li/H of old stars in the galactic halo as a function of [Fe/H] (bottom scale, which is referred to the solar abundance, 0 corresponds to the solar value, corresponds to 1/1000 of the solar value etc., astrophysical conventions : of the star – log(Fe/H) of sun). The time scale is also shown, note that these stars are very old (about 12–13 Gyrs old). Primitive lithium abundance is deduced from observations of low metallicity stars (black points) in the halo of our Galaxy. There is a discrepancy (about a factor 3 to 5) between the value deduced from these observed spectroscopic abundances and the one calculated (horizontal line).](/cms/asset/3b3a48d6-1021-4347-90e5-4ee86a8642a5/tfls_a_1411838_f0010_c.jpg)
Figure 11. Abundances by number of atoms relative to H for Li,
Be,
B,
B and
(and uncertainties) as a function of η, baryons/photons ratio. We see that these isotopes are extremely rare at the end of BBN (from Coc et al. Citation2012).
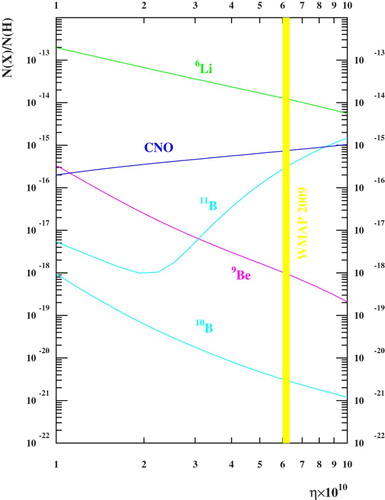
Figure 12. Same as Figure , but for Be and B. We note the very low abundance of these elements compared to hydrogen (between to
).
Figure 13. Supernova SN87a in the Large Magellanic Cloud (a satellite galaxy of the Milky Way located at 163 000 light years) has been observed in 1987 with all available detectors and telescopes (bottom before explosion, above after explosion). This is really the modern time supernova. This observation, in agreement with theoretical models of explosive nucleosynthesis, has strengthened our confidence in them, specifically concerning the synthesis of iron. (Copyright Anglo Australian Observatory).
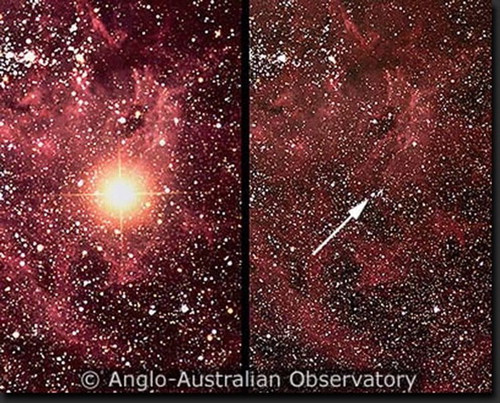
Figure 14. The nuclear chain leading to carbon formation.
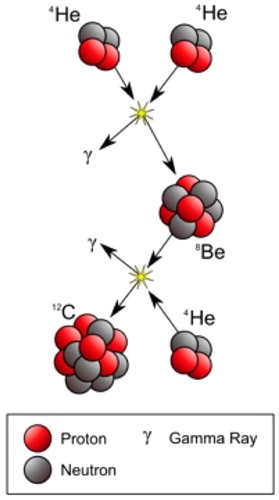
Figure 15. Nuclear levels of carbon and beryllium nuclei and the nuclear chain of carbon synthesis. is the excited level of carbon (from Ekstrom et al. Citation2010).
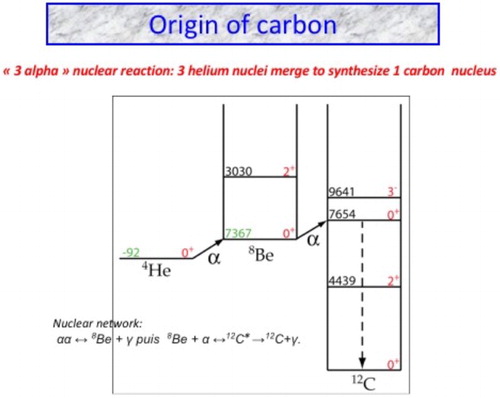
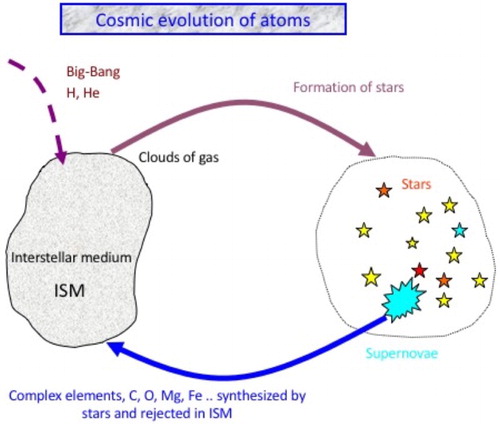
Figure 16. Cosmic evolution of atoms in the Universe. Primitive clouds of gas are composed of hydrogen and helium coming from big bang. Inside them, gravitational contraction induces star formation; the synthesized complex elements are rejected into the interstellar medium through essentially SN explosions.