Figures & data
Figure 1. Rarefaction curves for (A) bacterial and (B) fungal datasets based on sequencing reads, describing the observed number of OTUs as a function of the sequencing reads per samples. Each color represents the sample (n = 80). Saturation of the curves represents the good coverage and quality of the data-sets.
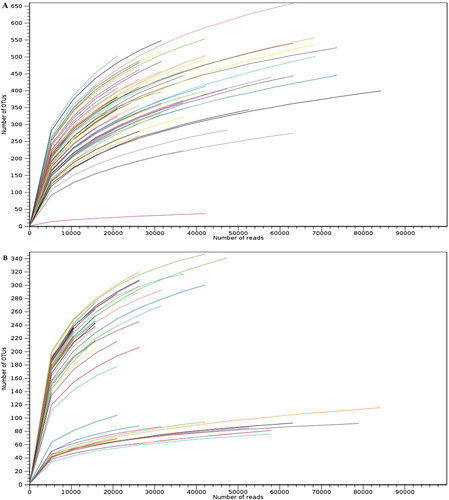
Figure 2. Prevalence plot (taxa prevalence versus total count) for (A) bacterial and (B) fungal taxa representing the phylum level diversity across samples. Each point corresponds to a different or unique taxon. The y-axis represents the fraction of samples, these taxa are present.
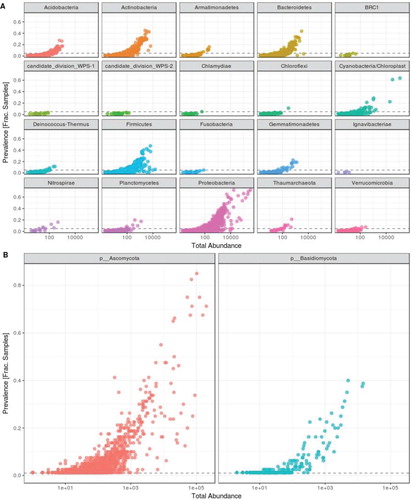
Figure 3. Relative abundances of (A) bacterial and (B) fungal genera present on each cultivar, grouped within their genetic pools (9 cultivars per genetic pool, top 20 taxa, characterized to the genus level and datasets were rarified to 5000 sequence reads per sample). Chao1 estimates of α-diversity for (C) bacterial and (D) fungal data-sets for three genetic pools. PCoA plots using Bray-Curtis distance between samples for (E) bacterial and (F) fungal data-sets among three genetic pools, explaining >60% variations with first two axes (taxa with variance < 1e-05 were trimmed).
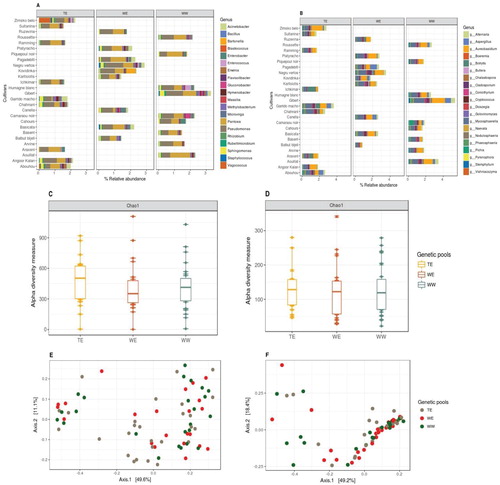
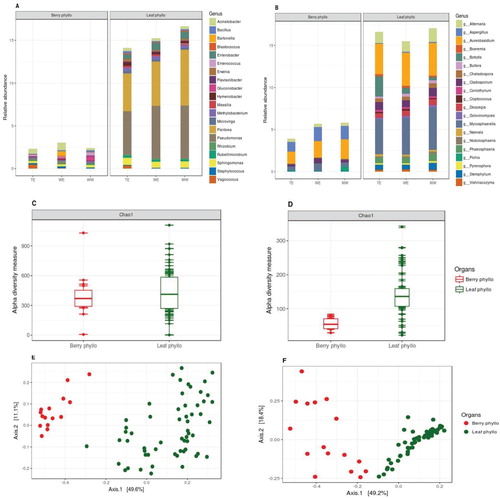
Figure 4. Relative abundances of (A) bacterial and (B) fungal genera present on leaf and berry samples, also grouped within their genetic pools (top 20 taxa, characterized to the genus level, datasets were rarified to 5000 sequence reads per sample). Chao1 estimates of α-diversity for (C) bacterial and (D) fungal data-sets for both the organ types. PCoA plots using Bray-Curtis distance between samples for (E) bacterial and (F) fungal data-sets as per leaf and berry samples based on Bray-Curtis distance matrices, explaining >60% variations with first two axes (taxa with variance < 1e-05 were trimmed).