Figures & data
Table 1. Basic information of 534 patients with hepatic hemangioma.
Table 2. Clinical information of 16 patients undergoing surgical treatment of hepatic hemangioma.
Figure 1. The size of liver hemangioma in different age groups. A. Total patients. B. Male patients. C. Female patients.
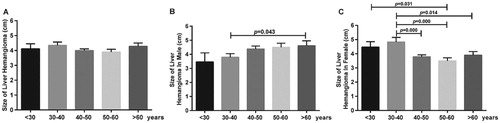
Table 3. Hemangiomas in different age groups and gender groups.
Figure 2. The growth changes of hepatic hemangioma in different age groups. The amount of change is expressed in cm/years, and the statistical description uses the median and inter-quartile range. A. Male patients. B. Female patients.
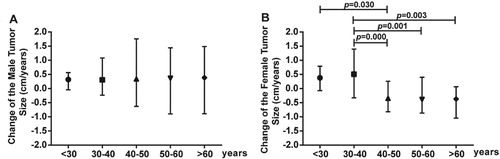
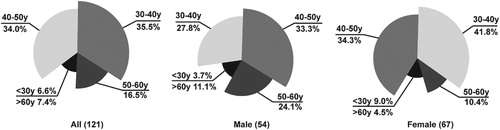
Figure 3. Distribution of hepatic hemangioma in 121 cases with ‘significant enlargement’. Significant enlargement was defined as an increase in size >1 cm during follow up with a final diameter >2 cm.