
Figures & data
Table 1. Baseline characteristics of renal cell carcinoma (RCC) patients included in the analysis according to the histology (N = 89,968).
Figure 1. Incidence of: (a) clear cell renal cell carcinoma; (b) papillary renal cell carcinoma; (c) chromophobe renal cell carcinoma cases from 2001–2013 assessed through Join-Point program.
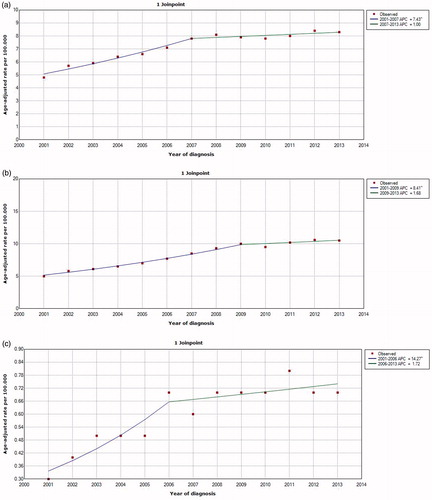
Figure 2. Kaplan–Meier curve according to histological subtype of: (a) overall survival of non-metastatic cases; (b) cancer-specific survival of non-metastatic cases; (c) overall survival of metastatic cases; (d) cancer-specific survival of metastatic cases.
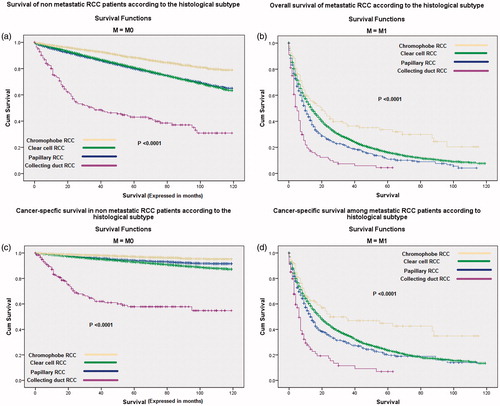
Figure 3. Kaplan–Meier curve of: (a) overall survival and (b) cancer-specific survival according to the type of local treatment of non-metastatic patients.
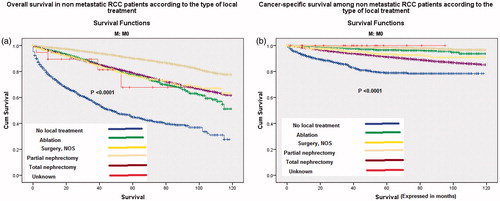
Table 2. Multivariate analysis of factors affecting overall and cancer-specific survival among non-metastatic RCC patients.
Table 3. Relative survival of metastatic RCC patients according to histological subtypes.