Figures & data
Figure 1. STARD diagram reporting flow of participants through the study comparing HC201, HCS with SYSMEX XP100 for Hb estimation in rural population of Odisha, India 2017.
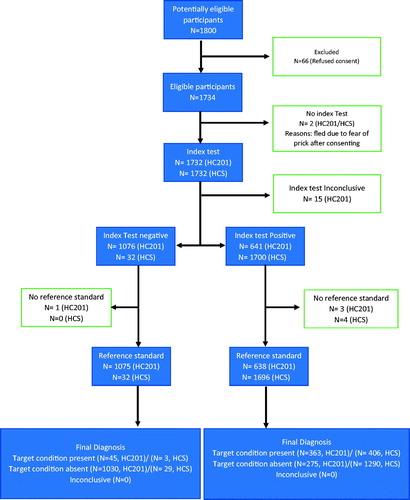
Figure 2. Age and sex distribution of subjects undergoing diagnostic accuracy testing in Tangi Rural Anemia diagnostic accuracy study, 2017.
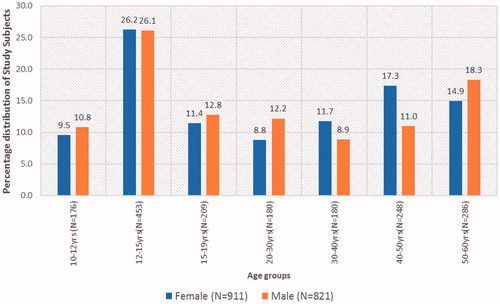
Figure 3. Box plots of population subgroups depicting distribution of true Hb values as determined by reference standard.
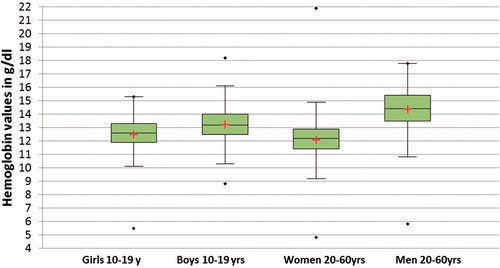
Table 1. Accuracy parameters of index test (HC201) among study participants in Tangi Rural Anemia diagnostic accuracy study, 2017.
Table 2. Accuracy parameters for HCS at different cut-offs among study participants in Tangi Rural Anemia diagnostic accuracy study, 2017.
Figure 4. Bland Altman plot comparing HC201 with SYSMEX XP100 for Hb estimation in rural population of Odisha, India 2017.
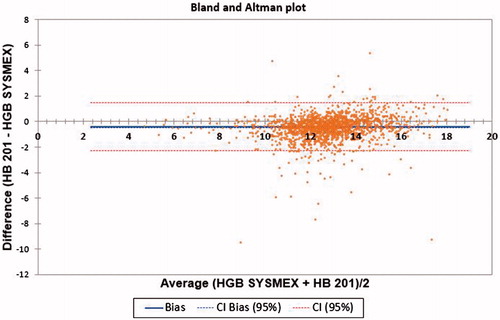
Figure 5. Bland Altman plot comparing HCS with SYSMEX XP100 for Hb estimation in rural population of Odisha, India 2017.
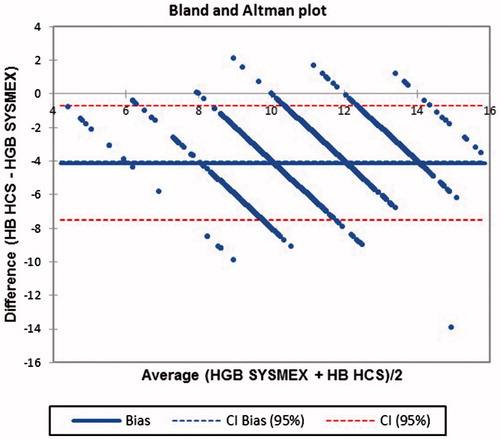
Figure 6. ROC curve comparing HCS with HC201 for Hb estimation in rural population of Odisha, India 2017.
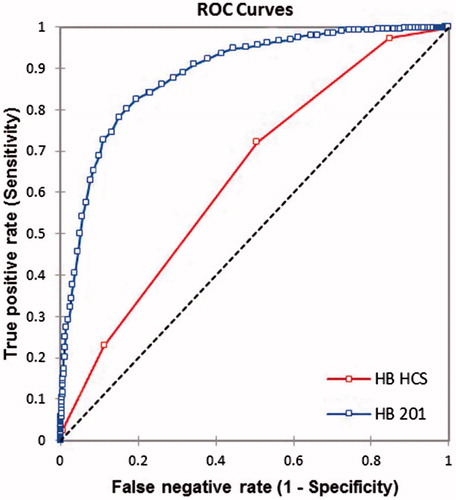
Table 3. ROC analysis parameters during comparison of HCS and HC201 for Hb estimation in rural population of Odisha, India 2017.
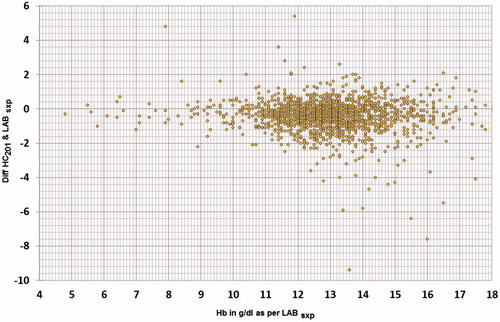
Figure 7. Scatter of difference of Hb values estimated by HC201 and Reference test against true Hb values provided by the reference test.