
Figures & data
Figure 1. Kaplan–Meier curves on overall survival by region of diagnosis. Available regional data included the following regions/states: West (California, Washington, Hawaii, Alaska, Utah); East (New Jersey, Connecticut); Midwest (Michigan, Iowa, Kentucky); South (Georgia, New Mexico, Louisiana).
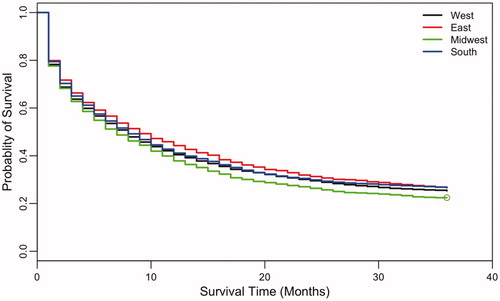
Table 1. Summary of a Multivariate Cox regression model between overall survival and covariates age, sex, ethnicity and region.