
Figures & data
Figure 1. Flowchart of patient selection. IGlar: insulin glargine, U100: 100 U/mL, and U300: 300 U/mL.
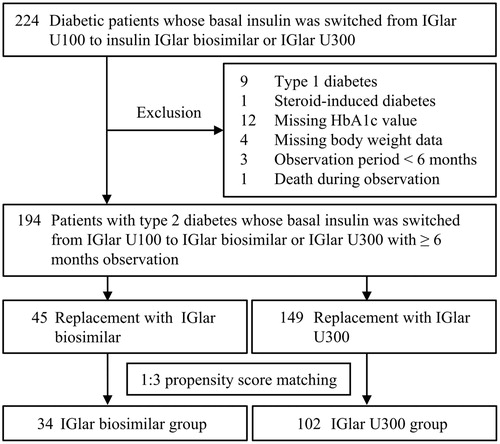
Figure 2. Distribution of propensity scores before and after propensity matching. IGlar: insulin glargine and U300: 300 U/mL.
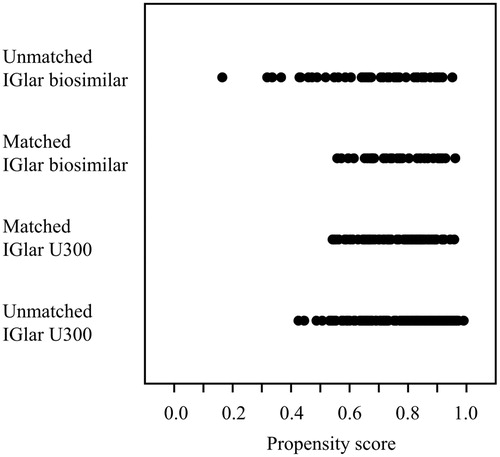
Table 1. Clinical characteristics of the patients at the baseline.
Figure 3. Changes in the HbA1c levels and body weight during the observation period. Closed circles and open squares indicate glargine biosimilar and glargine U300, respectively.
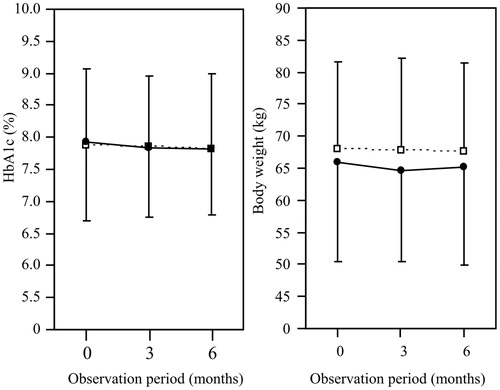
Table 2. Changes in the clinical parameters during the observation period.
Table 3. Association between the change in the HbA1c level and the clinical characteristics at the baseline.
Table 4. Odds ratios of the clinical characteristics at the baseline with the occurrence of hypoglycemia after the replacement of insulin glargine 100 U/mL.