
Figures & data
Table 1. Characteristics of the analyzed sample.
Figure 1. Distribution of the Rockwoods scores in the 2407 65+ evaluated. For each category, the sum of the percentages gives 100.00%. The distribution of the values of the Rockwood’s frailty score shows to be approximately bimodal.
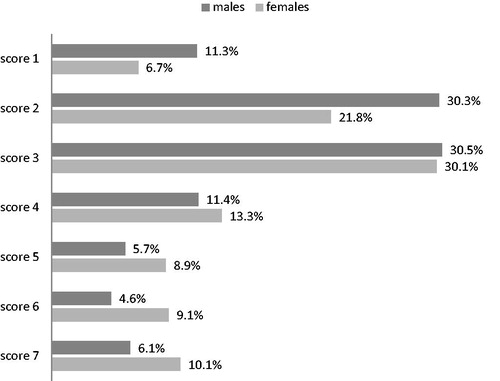
Table 2. Age and sex distribution of the prevalence of Frailty Status Status (so definied by a Rockwoods score >4) in the sample of 2407 elderly individuals evaluated with the Rockwoods Clincal Frailty Scale (% value and 95% confidence Intervals).
Figure 2. Prevalences of mutually exclusive combinations of frailty and serious comorbidity. Standardization for sex of five classes of age (standard population: Veneto’s official dataCitation25) – the combinations of frailty and multimorbidity illustrated by the graph are mutually exclusive: so, for each stratum of age the sum of the percentages gives 100.00%.
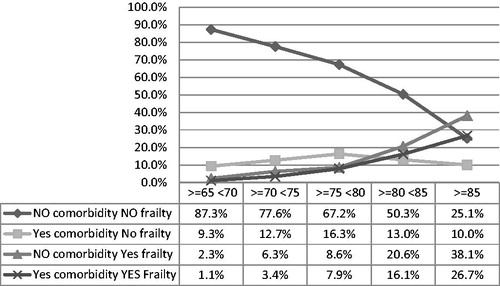
Table 3. Univariate and multivariate logistic regression models exploring the relationship between frailty (i.e.: Rockwood score >4) and comorbidity (i.e.: Charlson Score ≥4).
Table 4. The table illustrates the prevalence of frailty in some clinical condition in 2280 elderly people evaluated for frailty status and with optimal data input (see main text, see Appendix D).