Figures & data
Table 1. Characteristics of participants (n = 191).
Figure 1. Percentage of affirmative answers to questions 1–34 of the questionnaire. The red dotted line indicates the lowest percentage of affirmative answers in the questionnaire as a whole. The number of total answers is indicated for each question.
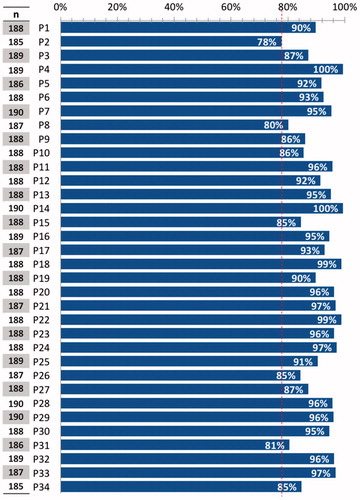
Table 2. Absolute frequencies and percentages of affirmative and negative answers.
Figure 2. Results of question 35. The number of participants stating that the use of some drugs was restricted in their hospital (n = 76), number with no restriction at all or need to request permission in particular cases (i.e. off-label use or recently approved drugs) (n = 115).
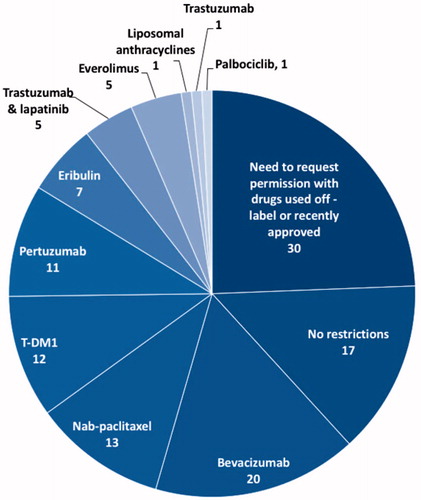
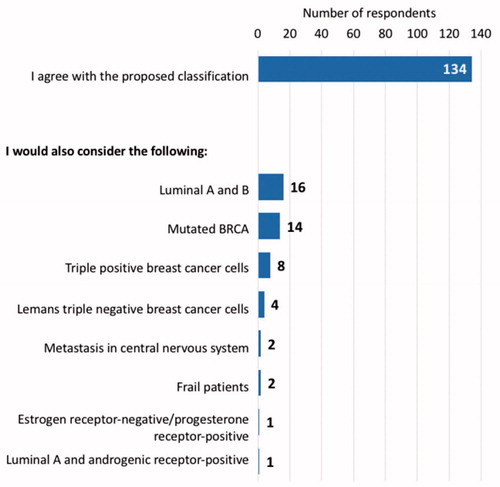
Figure 3. Results of question 36. The number of participants who agree with the present classification or who would modify or add new subgroups to the three patient profiles proposed.